Sep 16, 2019
Blindsided Bond Traders Can’t Count on Fed Dots
, Bloomberg News

(Bloomberg Opinion) -- Heading into September, the $16 trillion U.S. Treasury market was signaling dark days ahead for America’s economy.
On Aug. 28, 30-year yields dropped to an all-time low of 1.9%, a shocking figure that indicated no fear of inflation or sustained growth. By Sept. 3, bond traders were betting the Federal Reserve would slash its benchmark lending rate to below 1% before the November 2020 presidential election, from an effective rate of 2.13% now. Many measures of the U.S. yield curve remained inverted. Recession signals flashed just about anywhere investors looked.
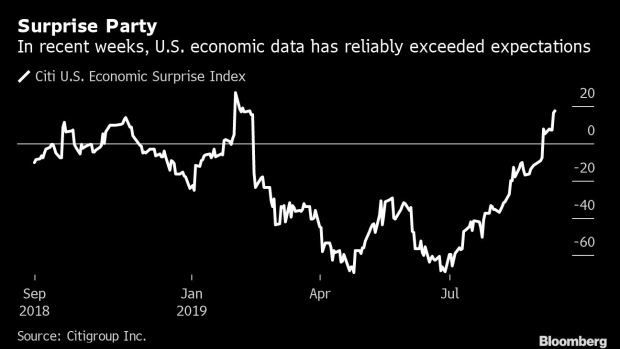
Now, just days before the Fed’s next interest-rate decision, the outlook is remarkably brighter. Last week, the core consumer price index data showed a 2.4% increase in August relative to a year earlier, the strongest pickup in inflation since 2008. Retail sales also beat expectations. Before that, average hourly earnings and the ISM non-manufacturing gauge topped estimates, helping to push Citigroup Inc.’s U.S. economic surprise index close to a 2019 high.
Much like the economists caught unawares, bond traders were also shocked, to say the least. By Friday, two-year yields had climbed 37 basis points from their lows earlier this month, while yields on 10- and 30-year bonds rose by almost 50 basis points, including a sharp double-digit increase on Friday. The only two comparable moves in the past several years occurred during the so-called Taper Tantrum in 2013 and after the presidential election in November 2016.
Effectively, traders’ thinking comes down to this: Fed Chair Jerome Powell said nothing in his speech before the central bank’s blackout period to dissuade them from pricing in an interest-rate reduction this Wednesday. But, what then?
The logical place to turn, it would seem, is the central bank’s economic projections, and in particular its “dot plot,” which aggregates officials’ expectations for the future path of interest rates. It’s due for an update this week for the first time since the June meeting. At that time, the median dot called for zero cuts to the fed funds rate in 2019, and only one reduction in 2020. Obviously, things changed in a way policy makers didn’t see coming.
And therein lies the problem with relying on the dot plot. The Fed, for better or worse, is flying as blind as any time in the past few years, due in no small part to the unpredictability of President Donald Trump’s continuing trade war with China. Powell diplomatically acknowledged as much during his Sept. 6 remarks: “Sometimes it’s easy to get unanimity on things when the path is clear,” he said. “Other times it’s murky out there and there’s a range of views. This is one of those times.”
Of course, that won’t stop Wall Street from predicting what those views will look like come Wednesday at 2 p.m. New York time. Strategists at Bank of America Corp. see the median for 2019 dropping to 1.625%, effectively indicating central bankers will cut rates once more either in October or December; after that, they expect the Fed to signal no changes throughout 2020, with gradual increases to resume again in 2021 and 2022. TD Securities strategists also expect the Fed to signal another cut before year-end. John Herrmann at MUFG Securities Americas says he counts at least five of the 17 dot-plot participants who would dissent over another reduction in rates after September’s. Add a few more to the mix after strong readings on inflation and retail sales, and maybe the Fed will signal a pause for the rest of the year.
Rather than take a stab at what the dot plot will look like, Jon Hill at BMO Capital Markets focused instead on the question of whether the dots should simply be ignored:
“In the best of times, it would correspond to the FOMC's path-dependent baseline scenario, assuming their baseline economic forecasts play out. This was arguably the case for much of 2017 and 2018 and corresponded to a regular and predictable quarter-point hiking cadence.
Alternatively, in moments like this — when uncertainty is elevated and even the axiom that 'cutting rates will help spur growth' is up for debate — it's hard to interpret the dot plot as more than a general inclination and bias regarding the outlook. This has enormous value in providing insight into the Fed's reaction function to macroeconomic developments. Given the number of moving pieces, Powell wants to maintain flexibility both with regards to the current stance but also forward guidance.”
This advice – to not read too much into the precise levels of the dots – is probably bond traders’ best bet. Powell has made it abundantly clear that he and his colleagues are focused on doing what’s necessary to sustain the expansion. That means if economic data persistently weaken, they will ease policy. And if Trump ratchets up the trade-war rhetoric, as he did less than 24 hours after the Fed’s last meeting, they will also probably ease policy.
It also has to be said that the Fed has shown time and again to take its cues from the bond market. Traders had priced in a quarter-point rate cut on July 31 way back in early June, and Powell opted not to push back even though he probably could have. If policy makers think the economy is strong, but market prices suggest the opposite, investors have history on their side to anticipate the central bank will ultimately capitulate.
It’s hard to say whether that trend ought to be comforting or frightening for bond traders, given the swift correction in Treasuries this month. Because if the Fed is flying blind, then so, too, are economists and investors, to some extent. A Bloomberg survey of 57 analysts, released on Sept. 13, showed a median estimate of 1.7% for the 10-year U.S. yield at year-end. The highest forecast was for 2.58%, and the lowest was 1%. The difference of opinion only widens in 2020.
Obviously, whether Treasuries soar to new records or keep unwinding their recent gains will have enormous implications for profits and losses among bond investors. Unfortunately for those looking for some direction, the Fed’s dot plot won’t be the guiding light to put them on the right side of the trade.
To contact the author of this story: Brian Chappatta at bchappatta1@bloomberg.net
To contact the editor responsible for this story: Beth Williams at bewilliams@bloomberg.net
This column does not necessarily reflect the opinion of the editorial board or Bloomberg LP and its owners.
Brian Chappatta is a Bloomberg Opinion columnist covering debt markets. He previously covered bonds for Bloomberg News. He is also a CFA charterholder.
©2019 Bloomberg L.P.


