Jun 12, 2021
Catching Rides on Meme-Mafia Trades May Boil Down to Models
, Bloomberg News

(Bloomberg) -- Staring at a meme stock craze that shows few signs of abating, Wall Street is still wrestling with how to trade it.
Many traders scroll through Reddit blogs that cheer on day traders to suss out the next big thing. Others obsessively track Stocktwits citations. There are even firms hiring WallStreetBets veterans to get inside the heads of the people who call themselves apes with diamond hands.
The stakes are high. Meme stocks like AMC Entertainment Holdings Inc. and GameStop Corp. have been known to double in no time. Day traders have banded together to target hedge funds’ short positions. And -- face it -- no investment professional wants to be bested by a 24-year-old celebrating a 32% gain with chicken tenders.
Now Goldman Sachs Group Inc. has developed models that may help crack the code.
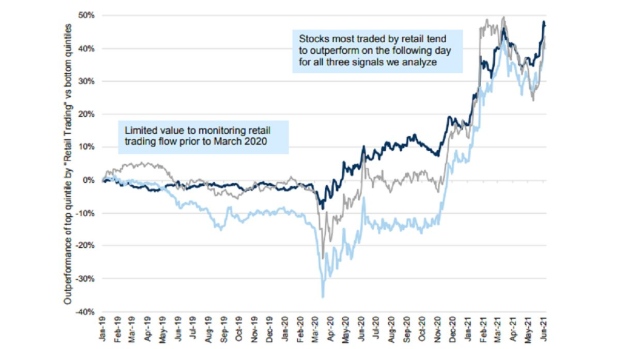
Using metrics to detect jumps in retail activity, Goldman strategists led by John Marshall developed three trading models to take advantage of sudden spikes in demand of certain stocks.
While these aren’t killer apps -- each model has returned more than 50% since the market bottom in March 2020 compared with a 90% gain for the S&P 500 Index -- they do reveal patterns in what often seemed like complete trading chaos.
Still, professional money managers should take care when using these models, according to Michael O’Rourke, chief market strategist at JonesTrading.
“You’re investing based on the moves of highly speculative, risk-taking people, who often don’t have a valid thesis or process for what they’re doing,” O’Rourke said by phone. “And obviously you’re just reacting to flows, so it’s more trading than investing.”
Read: Memo to Meme Raiders: Squeezable Stock Shorts Are Taking Cover
Some pros have backed away from the day-trader darlings. Hedge funds, for instance, have cut their ownership in GameStop to less than 2% from almost 13% at the start of the year, data compiled by Bloomberg show.
But others see opportunities in stocks embraced by the retail army, which Bloomberg Intelligence estimates accounts for nearly one quarter of total trading volume. In fact, Marshall and his colleagues at Goldman have seen more institutional investors wanting to play along. These pros tend to pour money in stocks where retail activity picks up and retreat after day traders pull back. As a result, stocks with high retail interest continue to rise in the days following the chatter’s peak.
“While only time will tell whether these trends represent a structural change, our analysis suggests retail trading activity continues to be a leading indicator (rather than contrarian),” the strategists wrote in a note to clients. “We believe retail trading activity is an indication of a large number of traders ‘paying attention’ to a stock.”
This pattern is where the strategists see trading opportunities. They employ three metrics to locate heavy retail activity: stock trades of less than $2,000, option trades where the number of contracts multiplied by the stock price is less than $5,000, and do-it-yourselfers’ moves using data from the Trade Reporting Facility.
Each day, stocks are ranked based on the metrics. After screening for liquidity, an order is placed at the end of the day to buy the top quintile against the bottom four. The positions are held until the next day before a rebalance takes place based on that day’s volumes.
As complicated as it all sounds, Goldman sees the potential for real-life applications.
“This could be implemented,” the strategists wrote in a response to questions. “You are calculating volumes, then trading. You are not trading concurrently.”
©2021 Bloomberg L.P.