Dec 24, 2020
China's rebound continues with exports, commodities booming
Bloomberg News
JPMorgan: Emerging Markets' Outlook Better Than Developed
VIDEO SIGN OUT
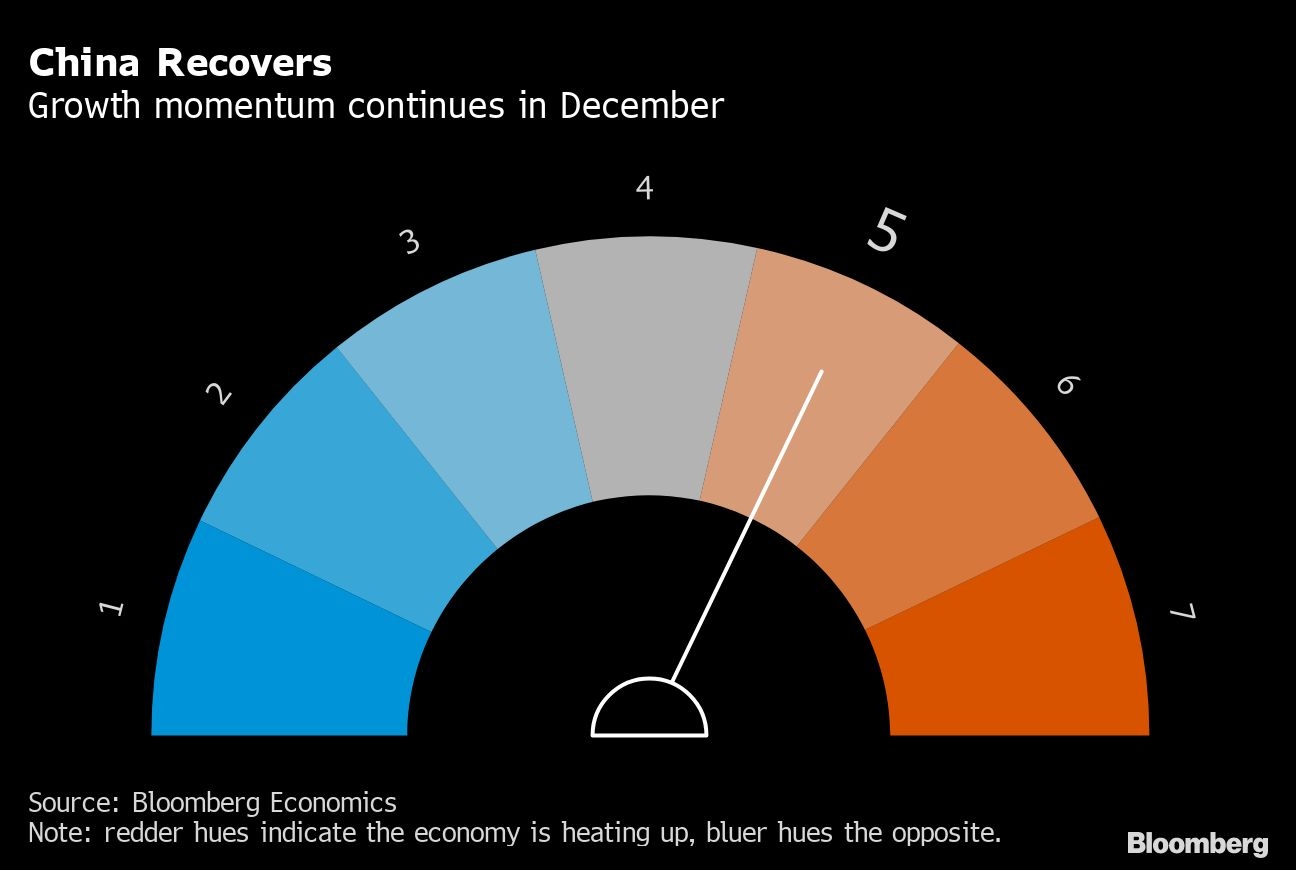
China’s economic recovery continued in December, underpinned by booming global demand for exports, rising commodity prices and a rallying stock market.
That’s the outlook from the latest aggregate index combining eight early indicators tracked by Bloomberg, which was unchanged from last month.
China was already pulling further ahead of other major economies in November, with domestic demand growing, foreign investment rising and record export demand propelling growth even as other major nations struggle amid soaring virus cases. With the Communist Party signaling there won’t be a sudden withdrawal of monetary and fiscal assistance, there’s growing confidence for a healthy expansion in 2021.
The export boom has been one of the strong drivers for China’s rebound, with goods shipments hitting a record $268 billion in November. That strength looks set to continue this month, with Korean exports rising 1.2 per cent in the first 20 days of the month and an index tracking the cost of shipping a container of goods reaching an all-time high last week.
There’s so much demand for containers to ship products from China to the U.S. that some companies are sending empty boxes back to Asia. Shipments to the U.S.’s busiest seaport in Los Angeles are expected to remain robust until at least early March.
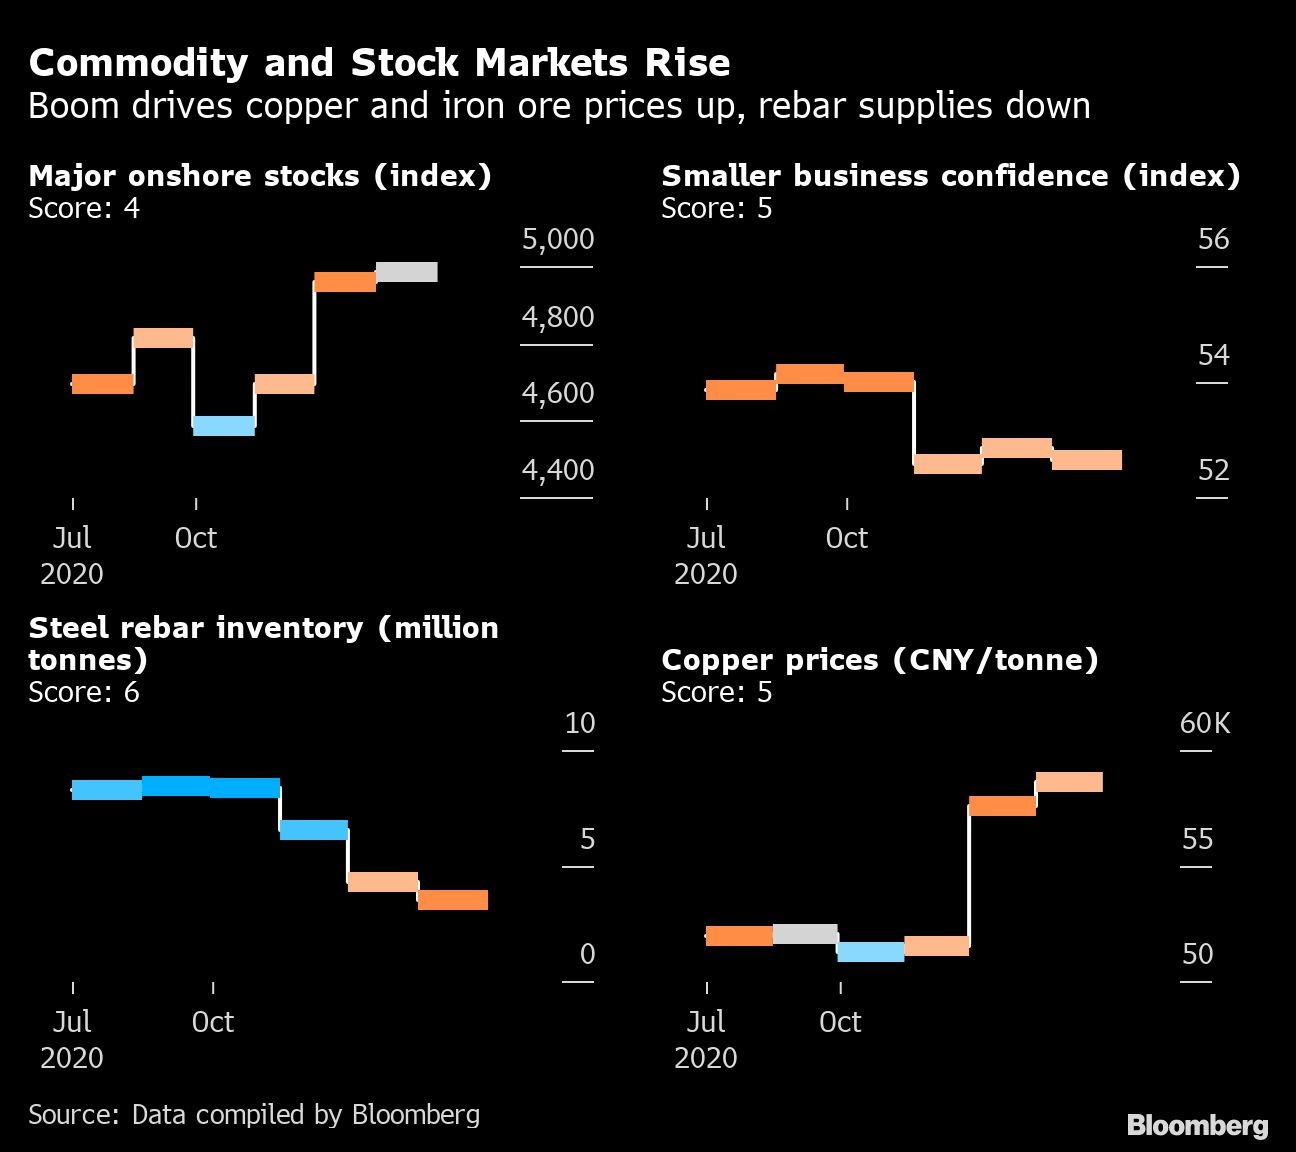
Smaller, export-oriented firms have outperformed their peers on the back of that demand, with an index tracking their current performance rising to a record-high 58.1, according to Standard Chartered Plc, which surveys more than 500 small and medium-sized companies in China each month.
An increase in the indexes for new export orders and production show “strong external demand and improved production capacity amid a COVID resurgence elsewhere,” according to the report from Lan Shen and Shuang Ding at Standard Chartered.
However, expectations for next year eased, possibly due a pullback in holiday demand and the upcoming Lunar New Year in February, they wrote. The main index for small companies slipped to 52.7 in December from 52.9 a month earlier. Numbers above 50 indicate improvement.
There might also be an improvement this month in the factory-price deflation that has plagued Chinese firms this year, with Bloomberg’s tracker for factory prices improving to -0.3 per cent in December, the highest level since February.
“The PPI tracker is based on market commodity prices, so the recent rise in commodity prices, such as copper, coal and iron ore, should have raised it significantly,” Bloomberg economist David Qu said. “But the final PPI, in my view, is unlikely to be so strong, as producers’ gate prices may lag.”
China’s relative success at containing the pandemic and optimism about global economic growth next year as vaccines are rolled out are fueling gains across industrial commodities from iron ore to oil. Iron ore prices are climbing and copper rose above $8,000 a ton last week for the first time in more than seven years due to tight supplies and strong demand.
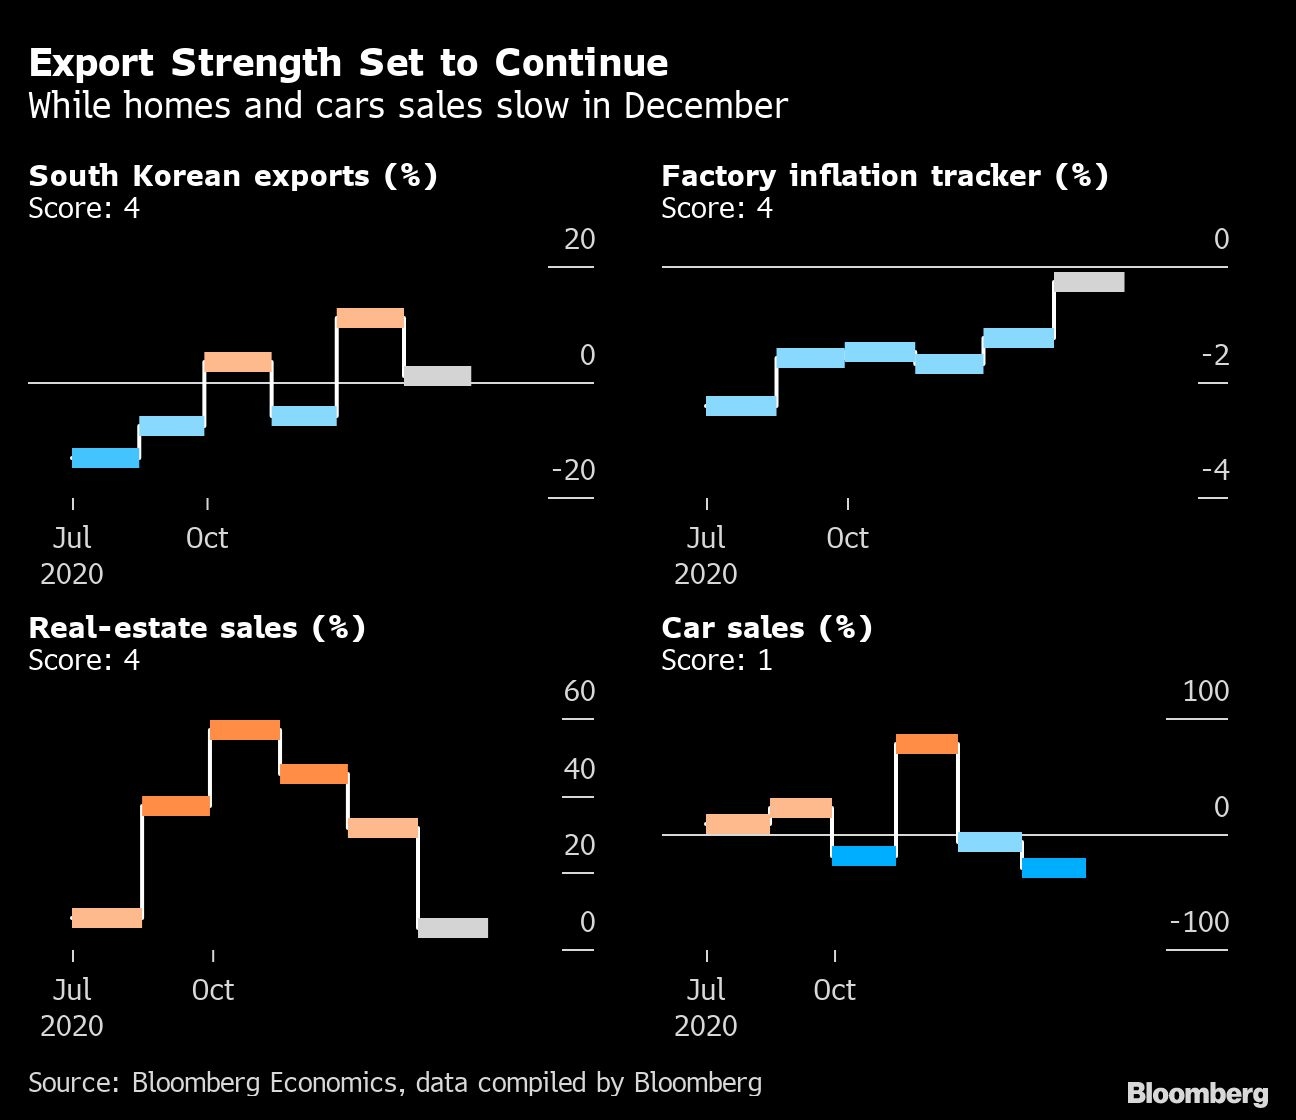
Those prices are rising despite increased production in China, with new records for output of coal and aluminum in November. That’s partly being driven by stimulus boosting spending on housing and infrastructure: In the first 11 months of the year, investment in property was up 6.8 per cent from the same period a year ago, while home sales were up more than 20 per cent in November, according to Bloomberg calculations.
That housing spending and the recovery of infrastructure investment is shown in the dramatic slump in stocks of steel rebar used in construction. At the end of last week there were 3.5 million metric tons of the steel reinforcing rods in stockpiles around China, less than one-quarter of the peak in March.
Chinese stock markets have also continued to rise, with the benchmark mainland stock index closing above 5,000 points on a number of days from late November and into December.
Early Indicators
Bloomberg Economics generates the overall activity reading by aggregating a three-month weighted average of the monthly changes of eight indicators, which are based on business surveys or market prices.
- Major onshore stocks - CSI 300 index of A-share stocks listed in Shanghai or Shenzhen (through market close on 25th of the month)
- Total floor area of home sales in China’s four Tier-1 cities (Beijing, Shanghai, Guangzhou and Shenzhen)
- Inventory of steel rebar, used for reinforcing in construction (in 10,000 metric tons). Falling inventory is a sign of rising demand
- Copper prices - Spot price for refined copper in Shanghai market (yuan/metric ton)
- South Korean exports - South Korean exports in the first 20 days of each month (year-on-year change)
- Factory inflation tracker - Bloomberg Economics created tracker for Chinese producer prices (year-on-year change)
- Small and medium-sized business confidence - Survey of companies conducted by Standard Chartered Plc
- Passenger car sales - Monthly result calculated from the weekly average sales data released by the China Passenger Car Association