Dec 22, 2017
Don Vialoux's Top Picks: December 22, 2017
BNN Bloomberg

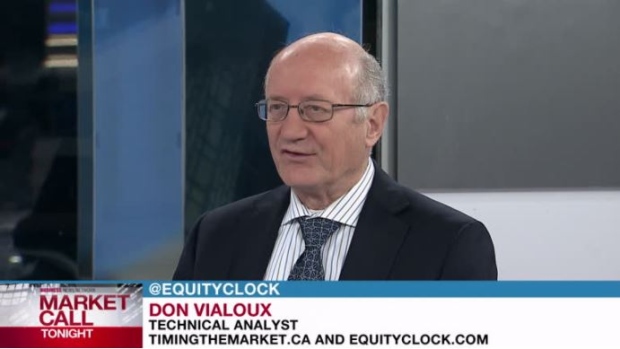
Don Vialoux, Technical analyst at TimingTheMarket.ca and EquityClock.com
FOCUS: Technical analysis and seasonal investing
_______________________________________________________________
MARKET OUTLOOK
The Santa Claus rally has arrived on time again! North American equity markets currently are in their strongest three-week period of the year from mid-December to the first week in January. Since 1990 the S&P 500 Index has gained in 20 of the past 27 periods for an average gain per period of 1.6 per cent. The TSX Composite Index has gained in 23 of the past 27 periods for an average gain of 2.4 per cent per period. Reasons for the Santa Claus rally include:
- Relief of tax-loss selling pressures
- Diminishing institutional activity
- Increased retail activity by investors in the Christmas spirit
- Bullish top pick choices by investment dealers for next year
- Investment of year-end bonuses in the first week in January
A word of caution! North American equity markets have a history of underperforming between mid-April and the end of September during a U.S. mid-term election year. 2018 is a U.S. mid-term election year. Control of the Senate and House of Representative by the Republicans is very narrow. Democrats increasingly are talking about possible impeachment of President Trump if they gain control. Investor anticipation of a change in control to the Democrats will greatly increase volatility in equity markets by next summer prior to the mid-term elections. Recent changes in U.S. tax laws probably will help North American equity markets early in the first quarter next year, followed by a significant correction.
TOP PICKS
GLOBAL X SILVER MINERS ETF (SIL.US)
Silver and silver equities have a history of moving higher between mid-December and the end of February. On the charts, units are oversold due to tax-loss selling pressures. A move above US$32.07 will change their trend from down to up. Demand for silver used in electronics continues to grow.
HALLIBURTON (HAL.N)
Seasonal influences turn positive from mid-December to the end of April. On the charts, the stock completed a reverse head and shoulders pattern last week on a move above US$46. Higher crude oil prices have prompted greater demand for oil services in the U.S.
GLOBAL X COPPER MINERS ETF (COPX.US)
Seasonal influences for copper and copper stocks are positive from mid-December to the end of April. On the charts, units began to recover this year at the start of their period of seasonal strength. World demand for copper continued to grow at a time when inventories of copper are near a multi-year low.
| DISCLOSURE | PERSONAL | FAMILY | PORTFOLIO/FUND |
|---|---|---|---|
| SIL | N | N | N |
| HAL | N | N | N |
| COPX | N | N | N |
PAST PICKS: AUGUST 25, 2017
BULLION IN CAD THROUGH HORIZONS GOLD ETF (HUG.TO)
- Then: $11.89
- Now: $11.67
- Return: -1.84%
- Total return: -1.84%
ISHARES S&P/TSX GOLD INDEX ETF (XGD.TO)
- Then: $12.41
- Now: $12.20
- Return: -1.69%
- Total return: -1.69%
CASH
TOTAL RETURN AVERAGE: -1.76%
| DISCLOSURE | PERSONAL | FAMILY | PORTFOLIO/FUND |
|---|---|---|---|
| HUG | N | N | N |
| XGD | N | Y | N |
WEBSITES: www.timingthemarket.ca / www.equityclock.com
TWITTER/STOCKTWITS: @equityclock


