Mar 14, 2022
Hong Kong Stocks Lose Two-Decade Anchor Amid Meltdown in Tech
, Bloomberg News

(Bloomberg) -- The implosion in Chinese technology stocks leaves strategists staring at chart patterns that few had thought possible.
Hong Kong’s benchmark Hang Seng Index slid 5% to a six-year low Monday, while the 30-member Hang Seng Tech Index sank 11%, the most since the gauge was introduced in July 2020. The meltdown was sparked by the worry that Chinese firms could be ostracized if the nation is seen as helping Russia with its war in Ukraine.
Chinese tech shares had already been nursing heavy losses due to tougher domestic and U.S. regulatory oversight, including the risk of being kicked off Wall Street. A gauge of U.S.-listed Chinese stocks is at its lowest point since 2013 after dropping 10% or more for three consecutive sessions.
A “material rerating for China tech may need to see a shift in regulatory tone,” said Marvin Chen, a strategist at Bloomberg Intelligence. He added investors must watch the interplay between China and Russia in case it impacts the U.S. regulatory posture.
Four charts sum up the shift in China’s tech sector and Hong Kong’s market.
Two-Decade Support Falls
A near 24-year-old trendline that acted as a floor for the Hang Seng Index has been breached, potentially dimming the longer-term outlook for the city’s stock market. The trendline originated from around the time of the Asian Financial Crisis in the late 1990s.
Fibonacci Level
The parlous longer-term prognosis need not preclude short-term Hang Seng bounces. One area of support lies at 19,400, the 61.8% Fibonacci retracement of the 2008 to 2018 rally. Below that, 18,800 is a technical level to monitor.
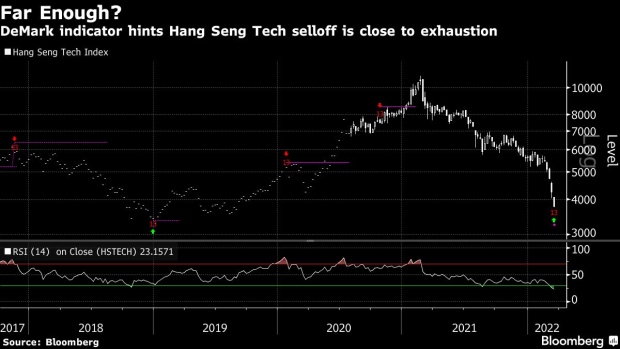
Tech Trouble
A DeMark indicator -- which tries to anticipate when a market trend has run its course -- suggests the selloff in the Hang Seng Tech Index may be nearing exhaustion. The TD Sequential study uses a method of counting applied to chart patterns. The index has printed the maximum possible 13 count. The last time that happened in 2018, the index staged a prolonged rally.
Sickly Dragon
The plunge in U.S.-listed Chinese shares is statistically notable. The Nasdaq Golden Dragon China index is now three standard deviations from a long-term regression. For some, that may suggest a temporary rebound is possible.
©2022 Bloomberg L.P.


