Aug 16, 2022
Incorrect Economist Views Help Traders Bet on Data
, Bloomberg News

(Bloomberg) -- Economic surprises imply that economists in the aggregate are incorrectly gauging where we are in the cycle. This could give valuable insight on potential market positioning before data releases.
US economic surprises have been falling, but we can glean additional information about what the consensus is inferring by looking at a breakdown in the surprise indexes.
The chart below shows the 12-month change in all of the sub-components of Bloomberg’s US surprise index. Overall, the change in surprises is roughly flat, suggesting economists over the last year have been pretty consistent in their forecasts.
However, economists have also been increasingly overestimating leading data over the last year (i.e. surprises in components such as the ISM and housing data have fallen), while they have been underestimating more lagging data (e.g. employment figures). In the aggregate, they are incorrectly gauging how late in the cycle we are.
This opens up opportunities for traders able to be nimble on the days of major data releases, which have become detrimental for long-only equity portfolios.
Data release days have risen in importance as the Federal Reserve strives to curb inflation. In its efforts to do so, the Fed has consciously moved toward offering less clear guidance around its rate decisions. Forward guidance was required to subdue volatility and allow cross-asset risk premiums to fall. The opposite is required to disrupt the sort of unchecked risk taking that indirectly influences demand -– one side of the coin of why inflation is likely in the process of becoming unanchored.
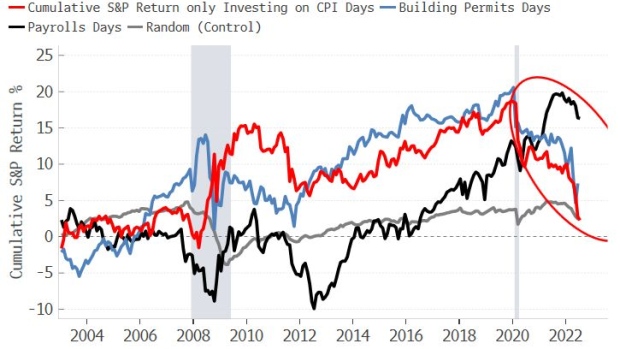
This means data releases are taking on even more significance for risk assets. Bloomberg stores the dates of major data releases. For some of them I calculated the cumulative return in the S&P 500 if you only invested on those days (going back to 2003).
First of all, there is a bias (both positive and negative) to investing on the day of the major releases studied. The gray line in the above chart shows the cumulative S&P 500 return investing on a random day each month (to act as a control), and the other lines deviate significantly from it in both directions. So data days are swing days for P&Ls.
Secondly, note that while the cumulative return from investing on payrolls days is just holding up (black line), the returns on CPI and building-permits days have fallen sharply since the pandemic. Most other data days show a similar decline, or the beginning of one.
Moreover, again note the data that are holding steady or improving (e.g. payrolls) tends to be more lagging, while more leading figures (e.g. building permits and CPI) are deteriorating. (Normally CPI would be considered lagging but in the current inflationary cycle the market is treating it as leading.)
Being long equities on the days of major data releases is becoming a riskier proposition, especially due to the twin uncertainty of the growing volatility in economic surprises seen around economic turning points, and a deliberately more opaque Fed.
Yet the silver lining is that, if the consensus is consistently underestimating how late we are in the cycle, we get added background about potential positioning before releases, making it easier to be on the right side of any post-data market move.
- NOTE: Simon White is a macro strategist for Bloomberg’s Markets Live blog. The observations he makes are his own and not intended as investment advice. For more markets commentary, see the MLIV blog
©2022 Bloomberg L.P.


