Sep 27, 2022
Investors Caught Flat-Footed as Stocks Try to Find Stable Ground
, Bloomberg News

(Bloomberg) -- That stock rally didn’t last long.
The S&P 500 logged its sixth straight session of declines on Tuesday, its longest losing streak since February 2020, after shrugging off a morning rebound of 1.7%.
The market’s irrational contours has made any airing of opinions on direction a dangerous business. Some of the biggest rallies in history have taken place in the middle of prolonged downturns, and while the setup for at least a near-term rebound is still in place, it didn’t happen Tuesday. Instead of looking up, chart watchers are now gazing down to find where the next bounce could come.
“For risk-averse investors, especially those with shorter time frames, it’s a hazardous environment,” wrote Jason Goepfert, chief research officer at Sundial Capital Research.
Index support
For John Lynch, chief investment strategist for Comerica Wealth Management, if the 3,640 level for the S&P 500 fails to hold, the 3,500 range will act as the next level of technical support. This, he said, represents the 50% retracement from the index’s March 2020 lows and the January 2022 high.
“From a fundamental perspective, the situation is also precarious, as the bedrock of corporate profit growth begins to deteriorate,” Lynch said. The S&P closed a hairline away from that threshold Tuesday at 3647.29.
Earnings estimates
Corporate profits, especially for the third quarter, have long been criticized for being too high. The market has seen more downgrades than upgrades for about four months straight.
“It’s the consensus view that earnings estimates have to come down,” Stephanie Lang, chief investment officer at Homrich Berg, said by phone. “And unfortunately, as earnings are coming down, stocks will follow because earnings need to go lower and the multiples need to go lower.”
Tech selloff
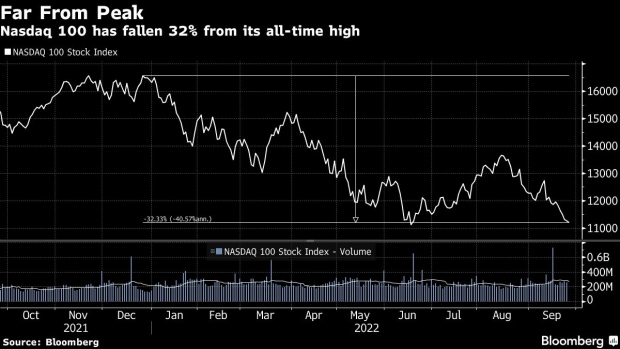
The tech-heavy Nasdaq 100 is now down just over 32% from its all-time high. Bespoke Investment Group said that the index will need to rally 48% to return to that peak. Tech stocks have been under pressure in the latest trading sessions, with nearly all the stocks in the index trading below their 10-day moving average.
Since the inception of the NDX in 1985, there have only been 20 other days with readings this low across all three breadth metrics, the 10-, 50- and 200-day moving averages, according to Goepfert. Every instance, Goepfert said, sparked the beginning of a significant bottom.
Oversold index
Meanwhile, the S&P 500 index has slipped into oversold territory. Craig Johnson, chief market technician at Piper Sandler, sees that as the market being primed for a bounce back. The RSI reading as of Tuesday almost hit 27, the lowest since January.
Not all chart watchers are so sanguine.
Jack Janasiewicz, portfolio manager at Natixis Investment Managers Solutions, says that his firm still has a slight underweight on US equities. But if the S&P 500 falls to around 3,500, that could be a good place to start buying, he says. A drop to 3,330, would be even more appealing.
(Updates with closing prices)
©2022 Bloomberg L.P.


