Aug 31, 2018
Jon Vialoux's Top Picks: Aug. 31, 2018

Jon Vialoux, research analyst at CastleMoore Inc.
Focus: Technical analysis and seasonal investing
MARKET OUTLOOK
So much for “sell in May and go away.” The total return of the S&P 500 Index is over 10 per cent since the start of May and volatility that’s common for this time of year has been largely absent. This despite headwinds pertaining to tariffs, turmoil in Turkey, legal worries for the U.S. president, weaker-than-expected economic data, midterm election uncertainty and commodity market weakness. The equity market has stayed afloat as investors remain focused on the solid corporate fundamentals. The value proposition for stocks has improved since the last all-time high charted in January. According to FactSet, the 12-month forward P/E for the S&P 500 Index now sits at 16.6, around the five-year average at 16.2. The level is down from around 18.5 recorded at the height of the market in January. Expected earnings per share continues to trend higher, which supports a positive bias for stocks.
But before you think that we’re in the clear for summer volatility, seasonal headwinds may grow in the final month of the third quarter. September has been the weakest month for equities, on average, over the past 50 years. The S&P 500 Index has shed an average of 0.6 per cent, with 44 per cent of Septembers showing a negative result. Losses tend to be dominated by the last two weeks of the month as investment managers reallocate portfolios ahead of the end of the quarter.
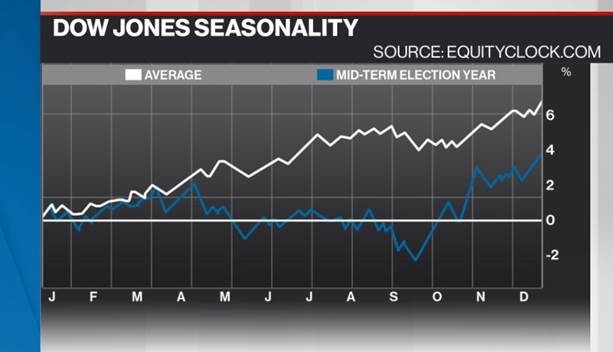
Between Sep. 19 and the last day of the month on Sep. 30, the S&P 500 Index has lost an average of 0.91 per cent with 31 of the past 50 (62 per cent) periods showing a decline. The period has typically been the ideal reset to reduce elevated equity prices, allowing investors to add to positions for the strength that is common through the fourth quarter. Cyclical sectors tend to get sold off the most during the approximately two-week stretch, but this has historically created opportunities in the financial, industrial, consumer discretionary and technology sectors.
On the economy, much of the data continues to show growth that is above average, fueled by the tax cuts that were implemented at the end of last year. But one area is raising concerns: housing. The year-to-date change in the sales of homes in the U.S. is running below average through July and inventories are running well above average as the high price of housing keeps buyers to the sidelines. The inventory of existing single family homes is up by 32.6 per cent through July, double the average increase through this point in the year of 16.1 per cent. Prices are at risk of adjusting to a new equilibrium. Typically, weakness in the housing market has been a precursor to a recession, therefore the trends in the housing market warrant further monitoring.
TOP PICKS
ISHARES U.S. INSURANCE ETF (IAK.N)
Financial stocks have been in the doghouse through the first half of the year as yields move lower and yield spreads narrow. But it appears that the tide may be turning. The stocks have been breaking above base-building patterns in the past month, looking poised to move higher within the period of strength ahead. The Dow Jones US Select Insurance benefits from a period of strength between Sep. 23 and Jan.3, averaging a gain of 5.62 per cent. Positive results have been realized in 16 of the past 19 years.
U.S. GLOBAL JETS ETF (JETS.N)
The ETF presents a basket of stocks in the airline industry with top holdings including Delta, United Continental, Southwest, and American Airlines. The industry has been cutting capacity and raising prices, which has boosted the growth in air revenue passenger miles to the best level in over a decade. The sector has been negatively impacted this year as fuel prices rise to multi-year highs, but with the period of seasonal weakness for energy commodities around the corner, the stocks in the airline industry may finally see a reprieve from this negative headwind. The stocks in the industry enter their period of seasonal strength around the end of August/beginning of September, running through the end of November. The Dow Jones US Airlines Index has gained an average of 12.64 per cent, with positive results realized in 13 of the past 18 periods.
PURPOSE HIGH INTEREST SAVINGS ETF (PSA.TO)
With the period of seasonal volatility for equity markets, investors may be tempted to sell to cash to wait out the potential market storm. This ETF allows investors to park their unused funds while earning a stable return. The current yield is 1.9 per cent, with distributions occurring monthly. The fund invests in high interest deposit accounts with one or more Canadian chartered banks, providing investors with greater yield than traditional money market funds.
| DISCLOSURE | PERSONAL | FAMILY | PORTFOLIO/FUND |
|---|---|---|---|
| IAK | N | N | Y |
| JETS | N | N | N |
| PSA | N | N | N |
PAST PICKS: MAY 18, 2018
ISHARES U.S. HEALTHCARE PROVIDES ETF (IHF.N)
Following a prolonged period of debate on how the Trump administration would address soaring drug prices, the recent proposals to increase competition in the pharmaceutical industry and promote transparency eliminates an overhang from the health care sector that has persisted for some time. Seasonally, the Health Care Providers industry benefits from strength between May 4 and Sep. 15, gaining an average of 6.64 per cent over the timeframe. The industry has outperformed the market in 14 of the past 18 seasonally strong periods.
- Then: $171.83
- Now: $196.96
- Return: 15%
- Total return: 15%
POWERSHARES QQQ ETF (QQQ.OQ)
Tracking the Nasdaq 100, this ETF has been an effective way to gain diversified exposure to technology-oriented companies in the market. Many economic reports in the past couple of months have suggested growth in the technology sector that is the best since the late '90s amidst the tech boom. The value of manufacturers' new orders for computers and related products industries are running a staggering 23.6 per cent above average year-to-date, representing the best performance in the over quarter century of data that we have on record. No matter what area of the economy you look at, the growth in the technology sector is beyond anything seen in the current century as both consumers and businesses advance into this digital world. Seasonally, the NASDAQ 100 has averaged a gain of 5.26 per cent between April 15 and July 17. The benchmark has outperformed the S&P 500 Index in 14 of the past 20 periods.
- Then: $167.46
- Now: $186.65
- Return: 11%
- Total return: 12%
BMO COVERED CALL DOW JONES INDUSTRIAL AVERAGE HEDGED TO CAD ETF (ZWA.TO)
This is a simple way of maintaining equity exposure during the volatile summer months. The ETF offers a covered call overlay to the well-known blue-chip benchmark, providing investors with an enhanced yield above that of the market. Coming into the more volatile time of year for stocks, investors are best suited to reducing risk and enhancing yield in equity portfolios and this ETF is an ideal way to do that. The fund will provide continued participation to the ongoing positive trend in equity prices, but the benefits of the strategy really materialize in the flat to negative trending markets that are common between mid-July and early October. The ETF has a listed yield of 4.14 per cent, approximately 2 per cent above the yield of the Dow Jones Industrial Average.
- Then: $22.87
- Now: $23.64
- Return: 3%
- Total return: 5%
Total return average: 11%
| DISCLOSURE | PERSONAL | FAMILY | PORTFOLIO/FUND |
|---|---|---|---|
| IHF | N | N | N |
| QQQ | N | N | N |
| ZWA | Y | Y | N |
TWITTER: @EquityClock
WEBSITE/BLOG: EquityClock.com


