Apr 2, 2018
Keith Richards' Top Picks: April 2, 2018
BNN Bloomberg
Keith Richards, portfolio manager at ValueTrend Wealth Management of Worldsource Securities
Focus: Technical analysis
_______________________________________________________________
MARKET OUTLOOK
If you study the recent short-termed corrections like those in 2010, 2011 and 2016 you will note that they’re usually driven by Fed-related events (usually fear of a stimulus plan ending). These market corrections have not been led by terrorist acts, political events or international catastrophes (man-made or natural). Fear of unplugging the stimulus drug drove markets to pull back – not world events. And that is what we have right now: a new Fed regime, and a new hawkish stance. The drug is being unplugged.
So we have the “Fed-fundamental” factor (removal of stimulus, hawkish outlook) that has pushed markets into corrective or bear market conditions a few times since 2009. What about the timing of such a correction? Can chart patterns tell us anything about when a significant (more than 20 per cent) correction will occur? Yes, they can!
You will note that corrections since 2009 have been led by volatility. In other words, you get lots of chop before the real deal happens. It’s my opinion that we are now in the “chop” stage that will lead us into a more significant bear market. I have noted here that my view is not for a "biggie" (that is, a 50 per cent meltdown) like the 2001 or 2008 bear. I’m in the 20 to 25 per cent bear market camp.
For the record, 2011 was the closest to a “real” bear market correction since the 2009 bottom. 2010 only saw a 17 per cent selloff and 2016 only experienced a 12 per cent peak-trough selloff, while we saw a 22 per cent peak-trough selloff in the summer of 2011. With that in mind, let’s look at the price patterns that proceeded 2011.
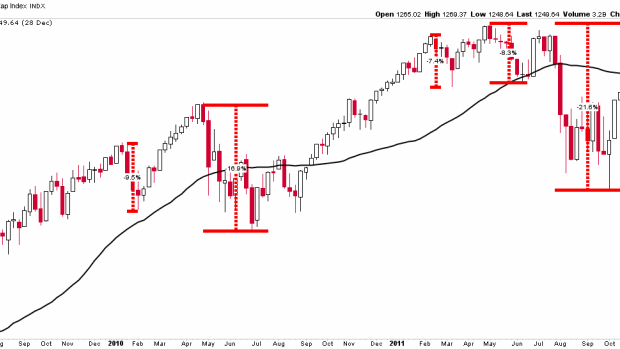
The chart below shows us both the 2010 and 2011 corrections. As noted above, 2010’s correction was 17 per cent peak to trough, and it occurred that summer (ending in July). The 2011 correction was a hair under 22 per cent peak to trough, and it occurred over the summer as well, although the damage was carried out into the fall (ending in October).
ONE PRE-SELLOFF PULLBACK IN 2010
Note that in 2010, there was an early corrective “setup” move of 9.5 per cent in early February, a rally, and finally the greater 17 per cent pullback that summer. This was close to a “bear market correction” of 20 per cent, so its worthy of noting despite its failure to enter into the “20 per cent” club.
TWO PRE-SELLOFF PULLBACKS IN 2011
Similarly, 2011 saw a 7.5 per cent early corrective “setup” pullback in February, followed by a rally. Only this time, that rally was followed up by another “setup” correction of over 8 per cent in May. The market rallied, and finally pulled back over the summer by 22 per cent – official bear market territory.
Subsequent rallies after each of these “setup” corrections fooled market participants into buying high again. The pattern was for the markets to see some interim volatility before the real storm hit.
This year, February once again provided the market with a nice correction (almost 12 per cent). As had happened in those prior years, markets rallied back in early March, although not to prior highs. Then, in mid-March, we saw another correction. It’s too early to predict that the market will rally back again, but so far the S&P remains over its February low and 200 day moving average.
CONCLUSION
As market participants, we're all playing a game of odds. The odds are, given my previously noted high Bear-o-meter reading, along with seasonal factors and past volatility patterns, that we'll see one more rally before the summer. It is my opinion that we are looking at a potential summer setup for a deep correction – possibly in line with that seen in 2011. Two takeaways from prior market corrections:
- Don’t fight the Fed.
- History can repeat itself.
Rather than view this potential with dread and fear, you and I can look forward to such a possibility as an opportunity to profit by trading the correction.
TOP PICKS
BROOKFIELD ASSET MANAGEMENT (BAMa.TO)
Brookfield is another overlooked stock that might represent a bit of a “value” play. Its bouncing off of a longer-termed, gently upsloping uptrend.
CONSUMER STAPLES SELECT SECTOR SPDR (XLP.US)
This sector has been hammered, and we're seeing early signs of movement off of the ETF’s long-termed support of near $50. Market flows from the overbought tech sector (the FANGs) will end up in the oversold sectors like staples.
BLACKBERRY (BB.TO)
BlackBerry reported strong earnings recently. A breakout through a technical lid near $14.50 suggests the chart is becoming constructive. If next resistance of $17 is taken out, we feel this stock has quite a bit of upside potential.
| DISCLOSURE | PERSONAL | FAMILY | PORTFOLIO/FUND |
|---|---|---|---|
| BAMa | Y | Y | Y |
| XLP | Y | Y | Y |
| BB | Y | Y | Y |
PAST PICKS: JAN. 8, 2018
VERMILION ENERGY (VET.TO)
We will hold Vermilion and a couple of other oil plays until the seasonal period ends in May.
- Then: $46.62
- Now: $40.92
- Return: -12.22%
- Total return: -10.91%
BMO EQUAL WEIGHT U.S. BANK HCAD ETF (ZUB.TO)
This ETF is holding above its breakout point of $28. Again, seasonals tend to become less favorable for the sector after May.
- Then: $30.28
- Now: $29.35
- Return: -3.07%
- Total return: -2.79%
BROOKFIELD ASSET MANAGEMENT (BAMa.TO)
It's on trend.
- Then: $54.06
- Now: $49.90
- Return: -7.69%
- Total return: -7.34%
Total return average: -7.01%
| DISCLOSURE | PERSONAL | FAMILY | PORTFOLIO/FUND |
|---|---|---|---|
| VET | Y | Y | Y |
| ZUB | Y | Y | Y |
| BAMa | Y | Y | Y |
TWITTER: @ValueTrend
WEBSITE: valuetrend.ca


