Nov 14, 2022
Lagged impact of monetary policy transmission likely continue to weigh on asset markets: Berman
By Larry Berman
Larry Berman's Educational Segment
VIDEO SIGN OUT
Following last week's surprising U.S. consumer price index report where the actual reported numbers were lower than even the most optimistic forecast, we expect members of the U.S. Federal Reserve will recognize the need to soon slow the pace of rate hikes.
What all this means is that there are more economic headwinds coming and that the Fed simply does not really know how to measure the lagged impact. Here is the conundrum. The lagged effect takes quarters to years to play out while the market can have the attention span no longer than the most recent headline.
The most recent one is from Federal Reserve Governor Waller who said on the weekend that they have a “ways to go” before cutting rates. Deputy Chair Brainard is speaking as we are on air in Washington D.C. on the economic outlook. Chair Powell does not have any speeches on the calendar in the coming weeks just yet. We suspect he will about a week before the Dec. 14 meeting.
As Milton Friedman et al have found, the economy's adjustment to changes in monetary growth is not a discrete, all-at-once event, but takes place as a distributed lag. The effects of a monetary policy action tend to begin gradually, build to a peak, and then subside. Thus, past monetary growth continues to influence gross national income long after the monetary growth occurs. An increase in the rate of monetary growth temporarily stimulates real economic activity. Once such resources as labour and capital are fully employed, or once inflation becomes generally anticipated, monetary growth produces a permanent increase in the price level. While this description of the transmission mechanism is extremely simplified it suffices for an examination of timing issues.
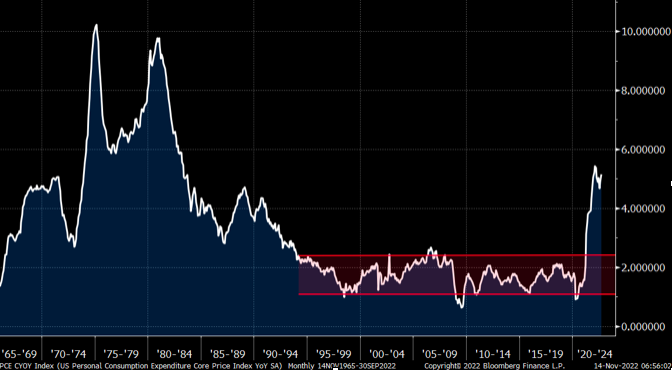
One theory suggests that the cost of money needs to be restrictive (read higher than inflation) to slow inflation. Many are estimating this to be about five per cent. The recent below expectations CPI number is encouraging, but they just do not know by looking at backwards looking data how it will play out. It seems to be what they are relying on. Our first chart is the core personal consumption expenditures price index year-over-year that is well known as the Fed target. You can see the longer-term one to two per cent range they are talking about getting back to (1995-2020). You can see that even in the great financial crisis in 2008-2009, the number did not turn negative. You can also see the mistake of the 1970's by letting inflation get out of control. They do not want to cut rates like was done in the 1970's that would lead to inflation expectations increasing. Thus, higher for longer and the hawkish commentary we should expect to keep seeing.
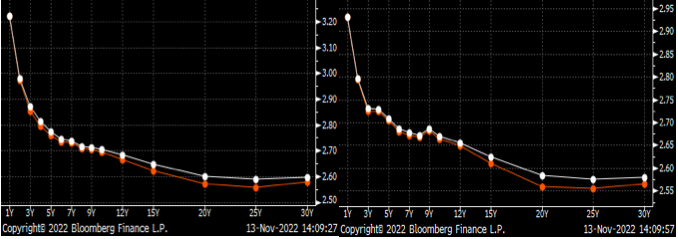
The inflation swap curve is a very good benchmark for market based pricing of inflation. We can see that short-term (one to two years) inflation expectations came down about 25-30 basis points.
We can see it a bit better in this chart of the one year inflation swap. You can see in Q1 when the Fed was still in the transitory camp compared to Q2 as they started to hike rates, and Q3 as they have aggressively been hiking rates, that expectations have come down.
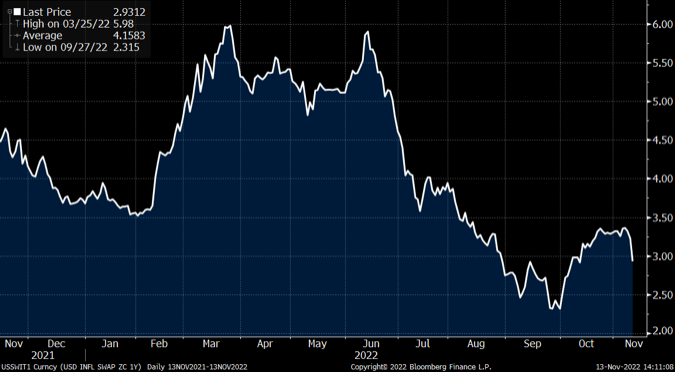
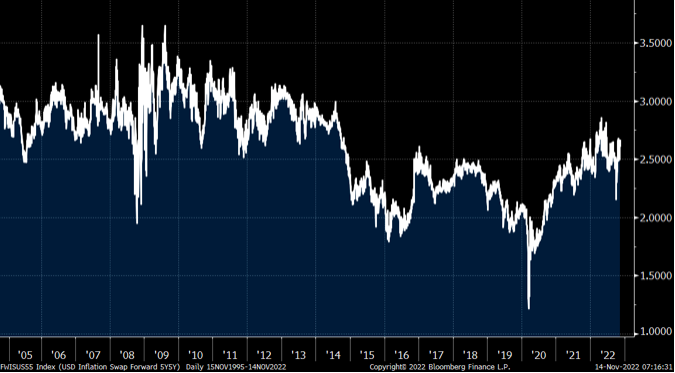
But the longer-term measure the FOMC likes (the five year outlook five years from now) has remained well contained.
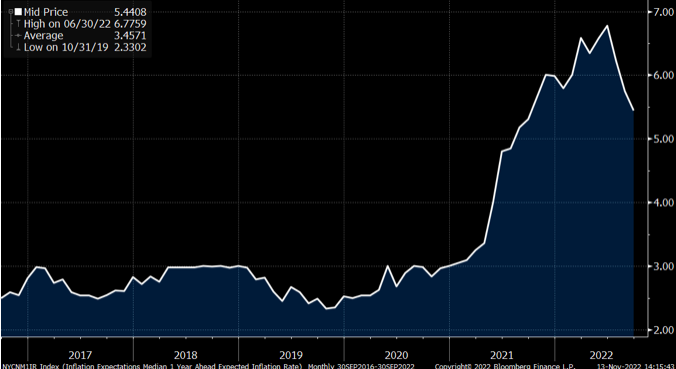
The other measure the Fed likes is a survey of consumers. It's one measure to price what above average income earnings in the financial markets price inflation at and quite another a survey of random average consumers. The one year expectation here is at 5.44 per cent versus the market based pricing at 2.93 per cent. It's this disconnect that speaks to the core of the lagged impact yet to be felt by Main Street that Wall Street seems more content with.
We continue the Fall 2022 virtual roadshow on YouTube and GoToWebinar. Sign up at https://investorsguidetothriving.com/ . We will focus this week on how to reduce volatility in your portfolio if as we suspect, the recent market rally has not marked the bottom yet. This educational efforts are all free to viewers. To thank us, we ask for your continued support. Over the past decade, we have raised over US$500,000 for brain health, dementia, and Alzheimer's research at the Baycrest Hospital. You can add your donation here. I match all BNN viewer donations up to US$25,000. Please help out with an assist.
Follow Larry online:
Twitter: @LarryBermanETF
YouTube: Larry Berman Official
LinkedIn Group: ETF Capital Management
Facebook: ETF Capital Management
Web: www.etfcm.com