Feb 13, 2017
Larry Berman: Building a position, using stops as a momentum investor
By Larry Berman
Last week I looked at how I build a position in a value stock (SU.TO) and how we transition out of it if it is not working for us. The key to this style of investing is understanding the following concept:
An important psychological cost to investing is anchoring bias. Anchoring is the behavior where people are swayed by something that has no relevance about what the stock might do in the future. For most, this is the cost basis of your position. Understand this because it will be one of the biggest investment mistakes you’ll ever make. The market on a go-forward basis has nothing to do where you bought your position so you must not care where you bought it.
If you are feeling stress in a loss position, you did not buy it well. And that is the core lesson here: “You need to evaluate the return and risk well in order to reduce the emotional bias we all can suffer from. I would only stop out and look for something else to own if after building a full position, the stock continues to fall or lags the benchmark. I would then need to find a better place to put the money.”
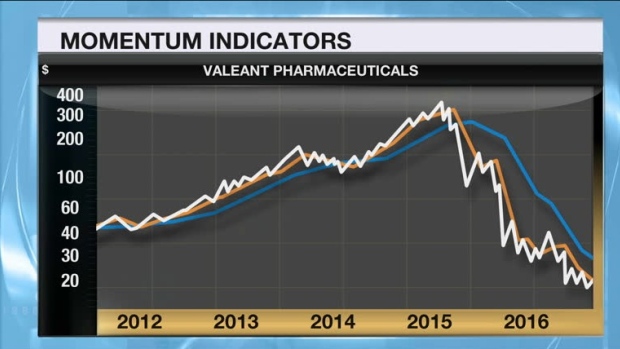
For the purpose of looking the momentum or growth style of investing we are going to use Valeant Pharmaceuticals (VRX.TO). It is the biggest boom and bust Made in Canada story stock since Nortel.
In order to stay with the trend, your stop needs to trail the price trend up to the point that the trend is broken. And herein lies the rub. Defining that trend in hindsight is easy, but in real-time you can’t know when the trend will end.
There are two methods I use to build positions. A break above an intermediate term trend line like the 50-day average or the break of a confirmed downtrend line for the initial one-third position. I would add another third position if we now see a higher high and higher low. And another third position if the intermediate term trend line moves above the longer-term trendline (not necessarily in that order).
- Buy the reversal
- Buy the confirmation
- Buy the breakout
- Trail the stop
Looking back, in the case of Valeant, the up-trend lasted several years before it ultimately broke. But the trend from the bottom in 2012 to the break of the first trend line in Q2 2014 saw the stock go from about $44 to $170 before falling to $117. The trend line broke at about $133 or 20 per cent below the peak a few months earlier. The tighter your trend lines, the more you will get stopped out, but the less of a drawdown situation you will be in. The tighter the trend line, the more you need to look at the market on a daily basis. Using weekly charts and focusing on longer-term trends can reduce the time you need to allocate to follow the markets. Of course, you need some way to chart prices and draw trend lines. Stockcharts.com is a good way to get started and most discount brokers have some basic charting that is available to customers.
The second wave started in Q4 2014 at about $128 and ultimately peaked in Q3 2015 at over $347. That trend line broke at about $280 or 20 per cent below the peak. Ever since, we have not seen a meaningful trend change to get back in. There have been no higher highs since early 2015, which means a trend follower (growth/momentum) investor should never have built a full position.
In order to stick with the trend you have to be willing to sit with significant drawdowns in as style like this. It can work for some investors, but those with high anxiety levels, building the initial position can be very stressful. The initial stop is often 20 to 25 per cent on a volatile stock like Valeant.
Also worth noting is that this style of investing get slaughtered in a choppy market without trending properties. And of course the rub here is that you do not know it’s trending until after the fact and you cannot go back and trade yesterday’s price.
Looking at the past year, we see a few tradeable counter trends. The initial stop needs to be below the point where we expect the trend has bottomed. The low in June was $24 and our first one-third entry location is a close above the falling trend line at about $37. So the initial stop is a bit over 30 per cent. We did not see a higher high or the 50-day average moving above the 200-day average confirming a longer-term trend change. That one-third position would have been stopped out at $38.
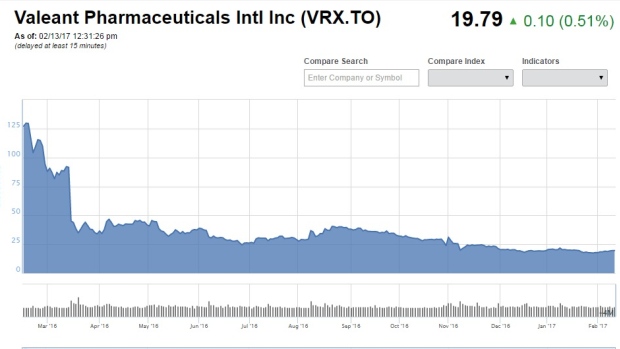
The current position would be entering a long position this week if we see a close above the falling 50-day average at about $20. The initial stop would be below the recent low at $17.18 and we would not add to the position unless the 50-day crossed above the 200-day and/or we closed above the January high of $23.16.
I love the idea of using smart indexing strategies to add returns and lower volatility in portfolios. Building positions and tactical investing is an important skill when managing your own portfolios.
Learn how to use techniques like this to evaluate risk and return in how to be a smarter investor in our seventh cross-Canada speaking tour. Free registration at www.etfcm.com. Help us raise money to fight Cancer and Alzheimer’s by making a voluntary donation with your registration. Over the past few years, Berman’s Call roadshows have raised over $200,000 for charity thanks to BNN viewers and our sponsors.
See Larry Live
| CITY | DATE |
|---|---|
| Toronto, Ont. | Saturday, Feb. 18 |
| Halifax, N.S. | Tuesday, Feb. 21 |
| Montreal, Que. | Wednesday, Feb. 22 |
| St. Catharines, Ont. | Sunday Mar. 5 |
| Kitchener, Ont. | Tuesday, Mar. 7 |
| Edmonton, Alta. | Wednesday, Mar. 22 |
| Calgary, Alta. | Saturday, Mar. 25 |
| Ottawa, Ont. | Saturday, Apr. 8 |
| Kelowna, B.C. | Wednesday, Apr. 19 |
| New Westminster, B.C. | Thursday, Apr. 20 |
| Vancouver, B.C. | Sunday, Apr. 23 |
| Markham, Ont. | Saturday, Apr. 29 |


