May 2, 2022
Larry Berman: Buy in May and make some hay
By Larry Berman
Larry Berman's Educational Segment
VIDEO SIGN OUT
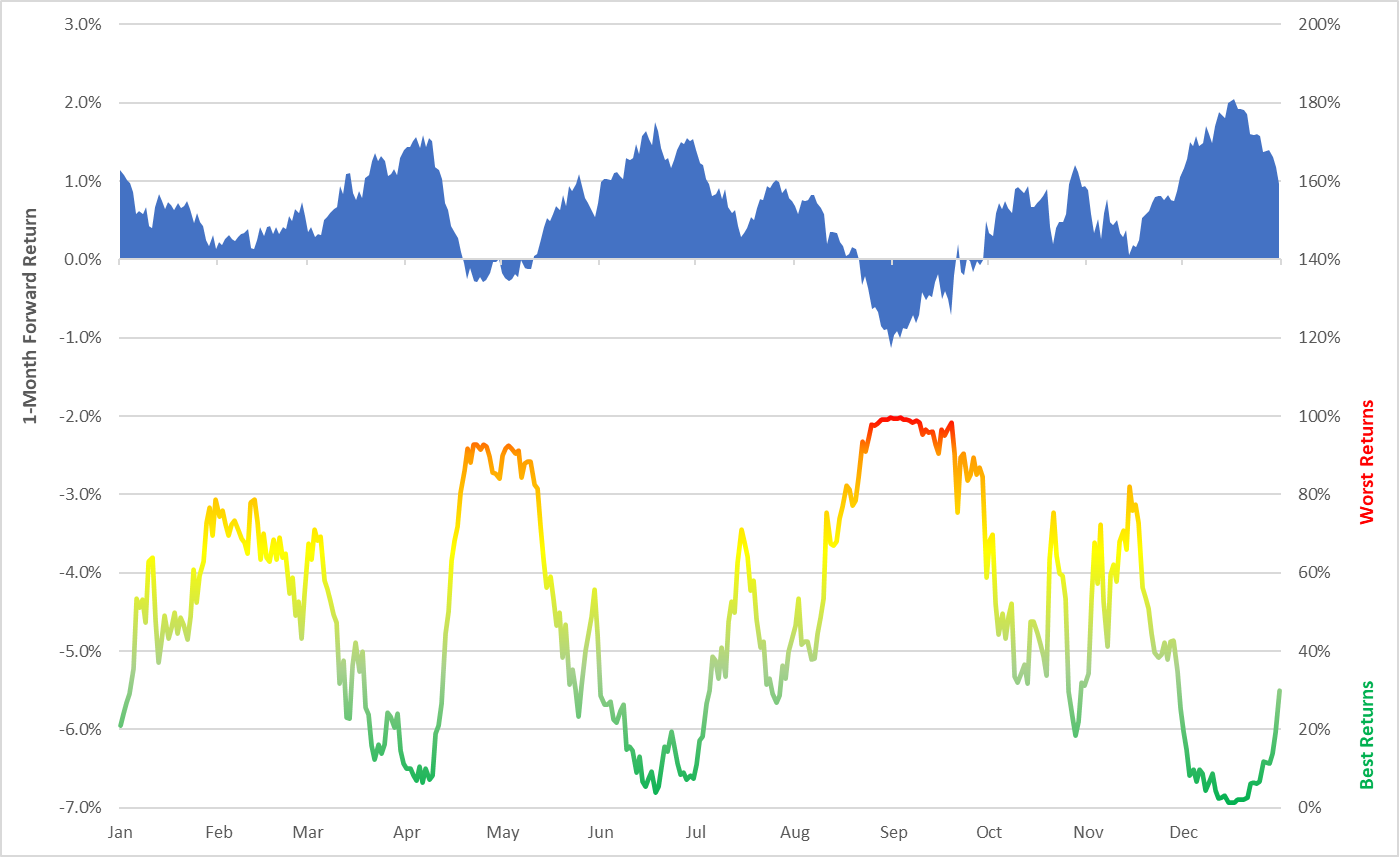
The old saying “making hay” means to turn something to one’s advantage. Our PRO-EYEs indicators were designed to look for periods of opportunity to help us make hay. All will have no doubt heard the phrase “sell in May and go away” over the years. It has to do with the long-term seasonality in markets where the bulk of returns come from October through April. Our seasonal chart of one-month forward returns (blue) shows that for most of May, the returns are poor on average historically, but April was historically one of the best months and this time around, it was one of the worst. In fact, the NASDAQ had its worst start to the year ever. For the S&P 500, April was the worst since 2008, the eve before the great financial crisis.
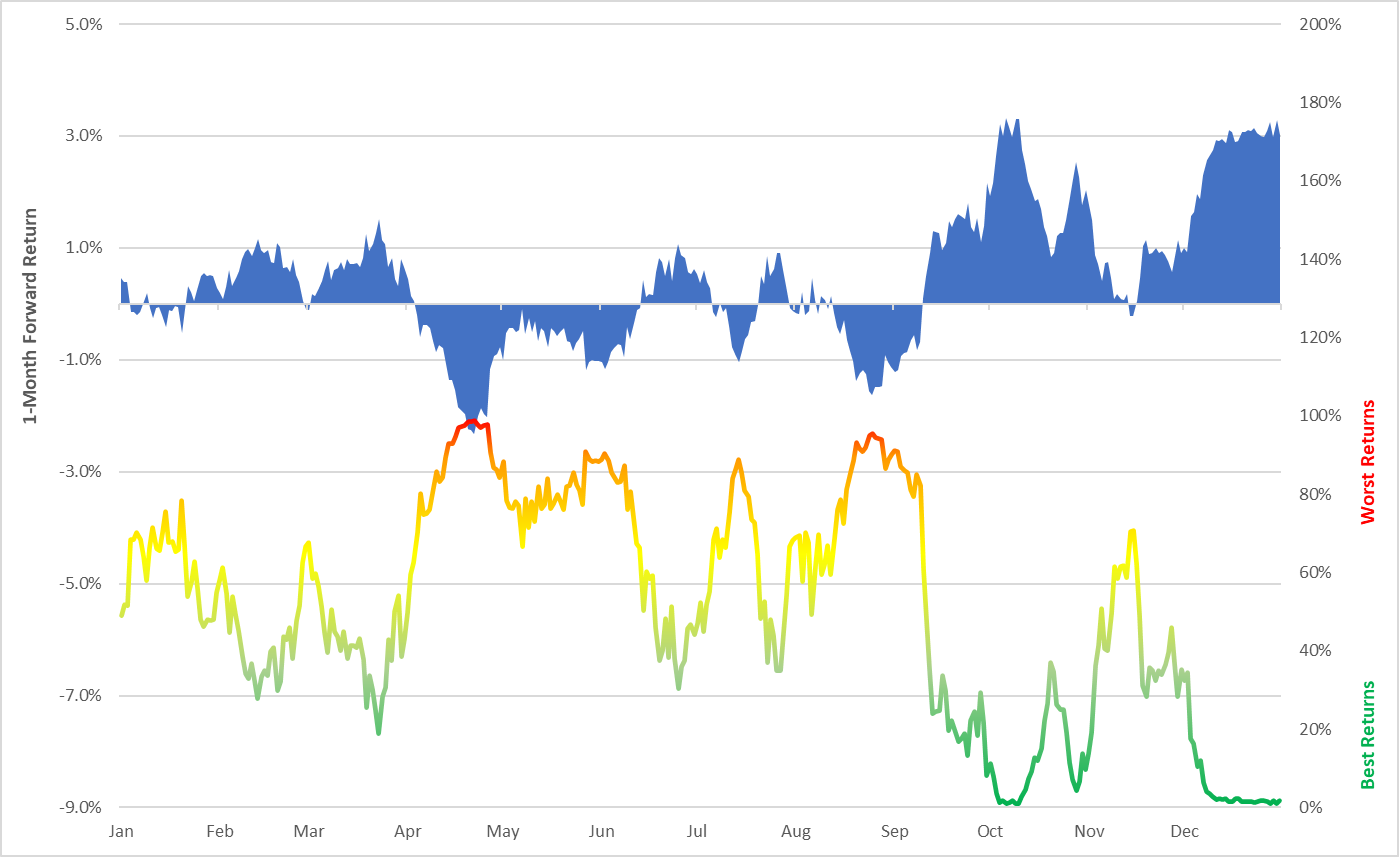
And the seasonal message gets worse during the second year of the presidential cycle. The ‘buy the dips’ opportunity in the second year of a presidential cycle does not show up until we get closer to the election. But the patterns on a year-to-date basis have been way, way off and there is a good reason to expect that bias to continue.
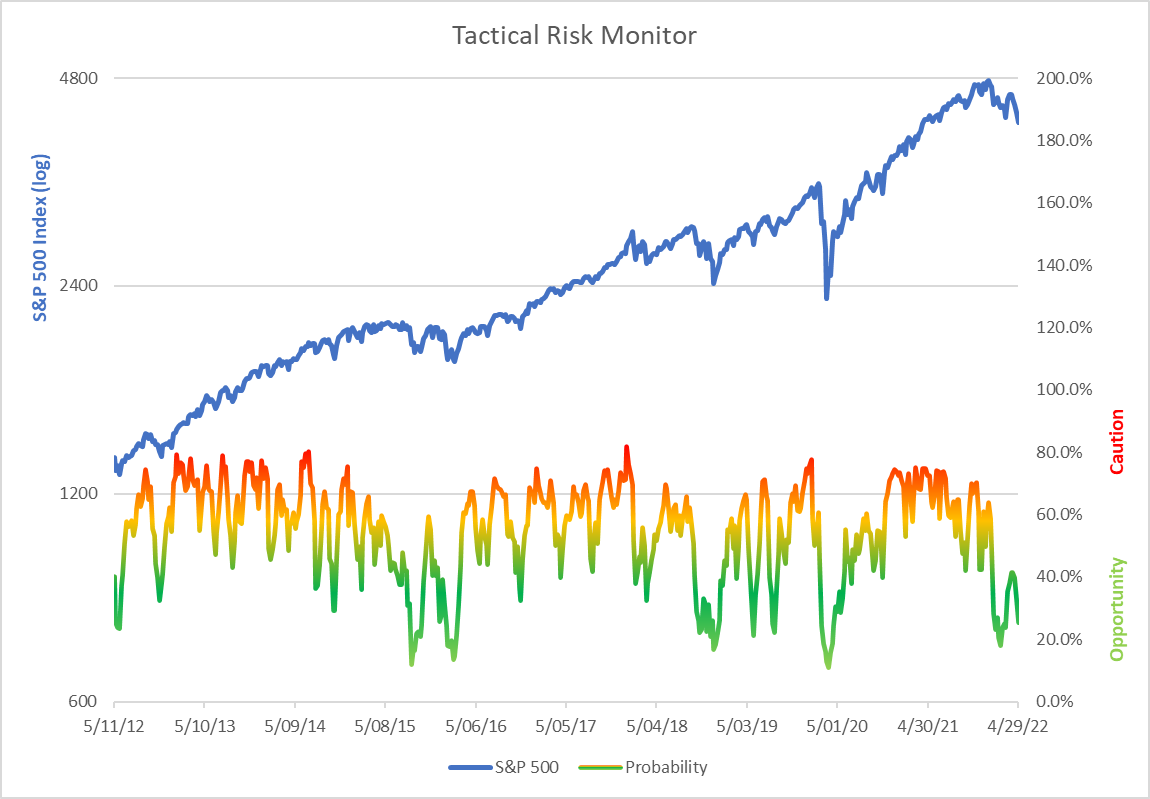
There are 12 tactical factors in the model, two of which are seasonal and are offering a negative outlook as we discussed, but most of the others are suggesting to buy the dip.
The five-day put/call ratio is at 37 per cent. The put/call ratio measures a degree of speculation and edging in the options markets. A reading around 40 per cent suggests near balance between bullish speculation and bearish protection. Last week, the average put volume increased 2,392 contracts per day while the average call volume increased 469 contracts per day. The strong rally off the March lows has ignited some call speculation, but the excitement is fading.
Speculative position S&P 500 futures are at 80 per cent. Positions of speculators in the S&P 500 futures contracts offers a potential future source of supply or demand. Current readings are elevated; it’s not until the position gets to an extreme that it becomes a good contrary indication. As of April 26, S&P 500 E-mini speculators increased their net long position last week by $2,716.1 million. Speculators have behaved very bullishly on the decline, suggesting lots of overhead supply to chew through. Earnings will need to be exceptional to overcome the Fed's policy path.
Percentage deviation from 200-day moving average is a mere one per cent. The market only spends less than 30 per cent of the time below the 200-day average. While this can denote a bearish trend, it most often coincides with a buying opportunity. It's rare that the market falls this much below the 200-day average without a tradable bounce coming. The 50-day average recently crossed below the 200-day average and marked the recent low perfectly. It suggests rallies should be sold until the current anxiety has passed. The bias has shifted far more towards selling rallies for now despite the market behaviour as the trend lines crossed. The failure to hold above the 200-day on the recent rally is a significant negative signal.
AAII bull vs. bear sentiment spread is at zero per cent and has rarely been worse. When the percentage of bulls exceeds the percentage of bears by a significant amount, we are likely much closer to a mark bottom than a top. Last week the percentage of bulls decreased 2.5 per cent while the percentage of bears increased 15.5 per cent. The recent rally off the lows was material and intense. Sentiment is swinging violently, which tends to be a strong characteristic of a bear market. Closing back at the lows so quickly speaks to the bearish sentiment. Most investors today have never experienced this type of inflationary impact today including those at the FOMC.
Seasonal pattern (all years) since 1928 is at 70 per cent. The one-month forward-based return is below average based on the four-year presidential cycle model. The second year of the presidential cycle offers the most volatility and lowest returns on average of all years combined. With both a fiscal and monetary reversal in play, there is a strong catalyst for poor returns this year. We are overweighting seasonal factors this year.
Presidential cycle (current year) since 1928 is at 87 per cent. The one-month forward-based return is significantly below average based on the current year of the presidential cycle model. The second year of the presidential cycle typically is the worst of all. That tilts the bias a bit in favour of being more cautious when seasonal factors are weakest. That expectation is historically seen between March and September.
Current vs. average volatility (VIX) is very low at 10 per cent. Last week, volatility was 18.4 per cent above the previous week. It was +28.4 per cent compared to its 50-day average. The 50-day average is 32.8 per cent above its long-term trend. In the past few weeks, we moved from extreme pessimism to complacency levels. It speaks to the high uncertainty factor and why volatility levels overall are elevated compared to longer-term averages in past cycles. We expect more volatility during the tightening cycle. Policy mistake is a huge probability.
Current vs. future volatility (VIX) is extremely low at six per cent. Last week, current volatility was 13.1 per cent above the previous week. Future volatility was 5.6 per cent above the previous week. The ratio of current volatility to future volatility is now inverted and in the range of a strong buy signal. Volatility levels remain elevated. We expect this to continue as investors debate central banks taking the punchbowl away while waying the risks of WWIII.
Percentage of S&P 500 holdings above 50-day average is an extremely low four per cent. The percentage of stocks in the S&P 500 above their own 50-Day averages is 27.4 per cent, which is 15.7 per cent below the previous week. It is 21.1 per cent below the average of the past month. Tactically, extremely close to a strong oversold buy signal. It's now been a few months since the market made its all-time high and so the opportunity for more stocks to break trend has developed. The 50-day average will cross below the 200-day average this week. Look for an oversold rally soon, but a move to new highs is unlikely until the reasons for the market corrections have been fully priced in. That could take a while given the rate hike cycle just started.
Percentage of S&P 500 holdings above 200-day average is at an extreme low of three per cent. The percentage of stocks in the S&P 500 above their own 200-day averages is 36.7 per cent, which is 7.4 per cent below the previous week. It is 9.3 per cent below the average of the past month. Statistically, breadth readings are extremely oversold and odds of a rally are high once a catalyst develops. At this point, we need a friendly FOMC and a ceasefire in the Russia-Ukraine war for more than a bounce.
Breadth-McClellan Summation Index is extremely low at three per cent. The breadth of the market is at extreme. This level of oversold conditions set the market up for a rally. Overhead divergences suggests that a rally to new highs is unlikely. But there should be enough support buying dips as long as earnings fundamentals hold up.
Overbought-oversold 13-week relative strength Index at one per cent. The 13-week RSI is extremely week at 36. It's rare the weekly falls below 30, so current readings are considered oversold for a bounce. The extreme seen last week coupled with the developing divergences suggest a good potential for a dead cat bounce in May. The catalyst could be some clarity from the FOMC and better-than-expected liquidity at Treasury.
The total tactical factor at 25 per cent is compelling, especially if we minimize the influence of the two negative seasonal factors. Tactical opportunity versus caution suggests more of a dip-buying bias for now, but we failed miserably holding the slightly higher high on the recent rally above 4,600. The market is not ready for the medicine the FOMC and other central banks are going to deliver. The price action, which is far more subjective than objective, suggests that we sell strength until most indicators are suggesting a buy signal. For now, seasonality offset the move up in the volatility curve. Readings are more oversold than not, and another dead cat bounce is possible.
If you have learned a few things over the years from our educational segments, please consider supporting one of my favourite charities. Dementia and Alzheimer’s research at the Baycrest Hospital/Rotman Research Institute is world class. Each year, I raise money for this cause and match BNN Bloomberg viewer donations. In the past nine years, we have raised almost $500,000 thanks to you. Please consider sponsoring here.
Follow Larry:
YouTube: LarryBermanOfficial
Twitter: @LarryBermanETF
Facebook: @LarryBermanETF
LinkedIn: LarryBerman


