Apr 24, 2020
Larry Berman: Fixing inequality in income and profits will be a bigger problem post-COVID-19
By Larry Berman
Larry Berman: Inequality will be a worse problem after COVID-19
VIDEO SIGN OUT
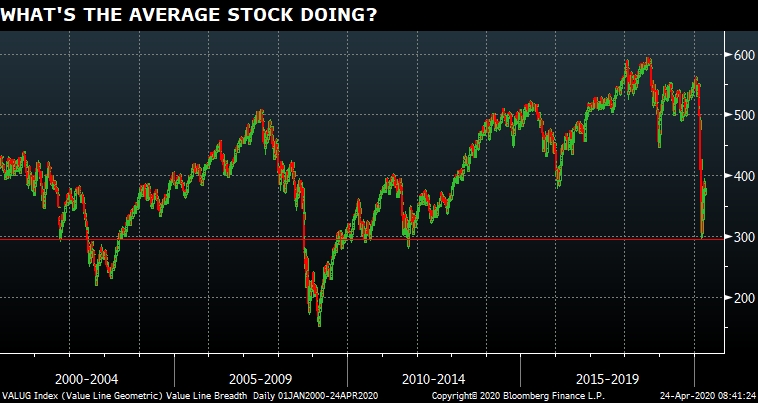
I’ve written about the Value Line Geometric Average before and what it represents.
The geometric average better represents the realized return that most investors experience from the average stock. For the U.S. markets, the difference between a traditional arithmetic (weighted) index and the average stock return is telling. It speaks to the inequality we see in the economy that has only been magnified in recent years.
Five stocks had trillion dollar valuations prior to COVID-19. I’ve long believed the biggest problem in the world for decades now is inequality. And the vast majority of policies we have in place like corporate bailouts and unprecedented quantitative easing (debt monetization) do not help the average company or the average citizen. We have seen this with parts of the rescue package going to companies that don’t need it as much as very small companies that will not likely survive.
Over the past 20 years, the geometric average of the U.S. market is flat. And people on the bottom half of the wealth spectrum have almost no exposure to equities. Their income comes from their labour.
The majority of profits and movements in the traditional market-cap-weighted indexes we know (Dow Jones or S&P) are driven by fewer and fewer stocks. Here are some facts:
- The top 20 Stocks in the U.S. account for about 30 per cent of the market (VTI) and 15 per cent of the world (VT) index
- VTI - the total U.S. market ETF - has 3,556 holdings
- About 30 per cent of the Russel 2000 (IWM) Small Cap stocks (the bottom half of this index) lose money, despite the record highs hit by some U.S. indices in recent years.
- Royal Bank of Canada (which accounts for 6.1 per cent of the S&P/TSX Composite Index) is the 85th largest in the world (VT). It would be the 62nd largest in VTI. Canada is a very small player in the world capital markets.
All these facts argue strongly for index-based investing (ETFs) as opposed to trying to pick individual stocks. There is nothing at all wrong with trying to pick the winners, but it’s hard… And it’s more expensive. But that’s not the main reason why I raise the issue. Inequality is the major issue. It impacts the social aspects of the world considerably. After all, do we not want policies to make a better world for everyone? I certainly do.
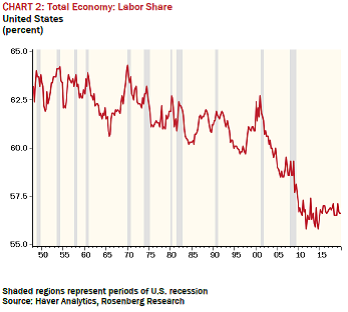
The next chart was prepared by my good friend David Rosenberg at his new firm Rosenberg Research. He is easily one of the most thorough, thought provoking independent economists in the world.
David did an important analysis of inequality recently. Not inequality in stock returns like I highlighted above, but for personal wealth.
One thing many politicians talk about, but have not been able to fix, is the hollowing out of the middle class. It’s why roughly 50 per cent of Canadians are living paycheque-to-paycheque. The bottom half is falling behind in the stock market and in the real world.
I see this as troubling for a good economy and strong growth in the future. Governmental support for people and businesses on a worldwide basis is important, to be sure, but it’s not going to fix the inequality issue. Until we fix that problem, I believe the global economy will underperform. The unprecedented support from governments is not a reason to be bullish.
The last time the labour share of the total economy was this low was back in the 1930s. And one of the learnings from the Great Depression was that unions became stronger and wages rose significantly. This is a good thing to be sure for the average worker. In the 1970s it helped lead to massive inflation. This means that margin pressures present themselves as wages rise. It also means that the market multiple is too high.
For decades after World War II, the multiple was in the 13-17x range. I think we are going back to that range. For me, that means markets are still far too expensive.
Inequality has been the biggest problem over the past decades
- Policies to boost stock markets increase inequality
- Political shifts to extremes (right and left) have led to similarly extreme policies
- Right wing policies urge greater border controls and localized supply chains
- Left wing policies have led to stronger unions and higher costs, but also rising incomes.
- All of the above has contributed towards stagflation
I think a lot about the policies the world needs to help solve some of these issues. I don’t see them today. What I see makes many of the inequality issues worse. I’m not trying to be too bearish, as I sometimes get accused. I get paid as a portfolio manager to position portfolios for the most likely outcome. Capital preservation for now seems more important than seeking growth. We need more sleep-at-night for a while longer. The growth-seeking time will come, too, as it does in every cycle. However, we have significant hurdles to get through before that period comes. The only question is how long it takes.
Good health to all.
Follow Larry online:
Twitter: @LarryBermanETF
LinkedIn Group: ETF Capital Management
Facebook: ETF Capital Management
Web: www.etfcm.com


