Jul 9, 2018
Larry Berman: Look for downside risk amid strong U.S. Q2 earnings
By Larry Berman

For me, revenue growth tells us much more about the quality of the market than earnings growth.
You can’t fudge revenues, though don’t tell that to Enron and Worldcom executives... Top line revenue growth is expected to be good for the next few quarters, though it is expected to slow somewhat.
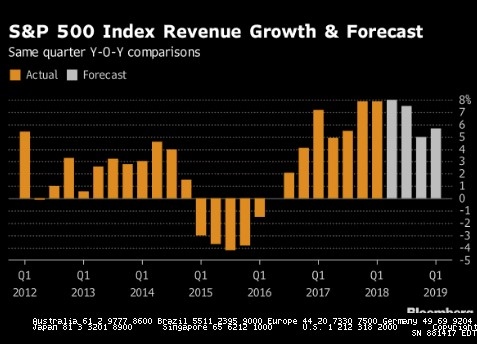
The vast majority of earnings growth over the past decade has come from share buyback programs. Late in the business cycle as we are today, the companies spending top dollar to buy back their shares may be hit the most in the next recession.
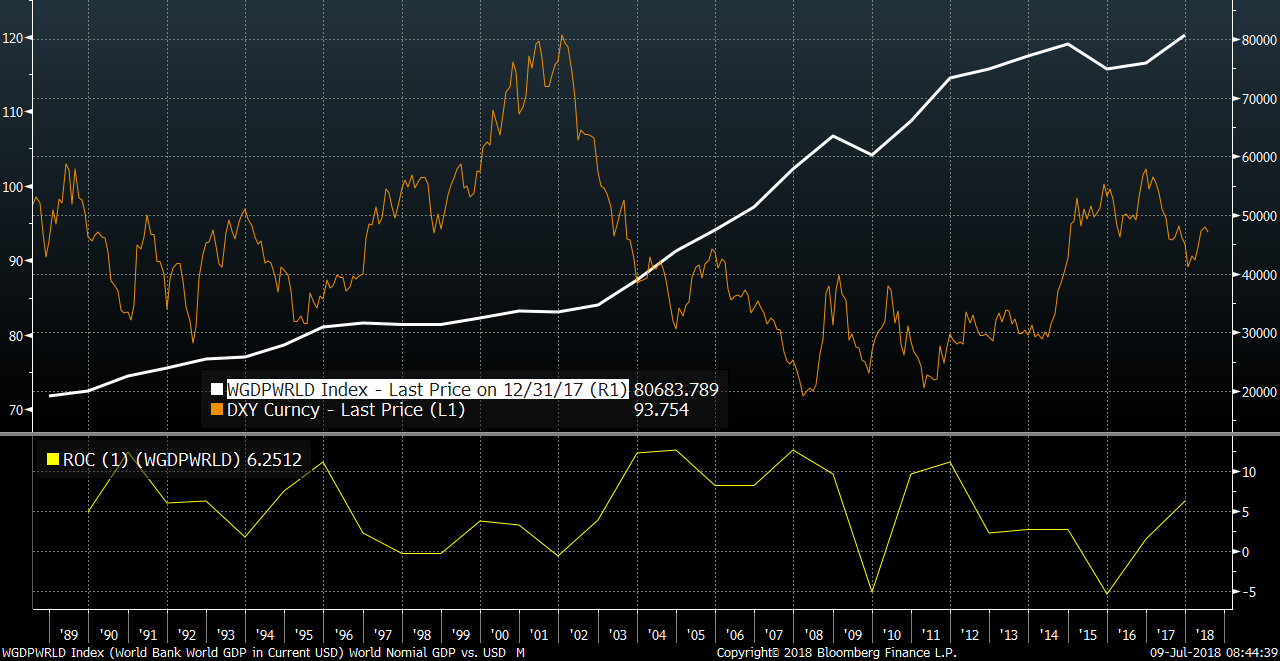
Part of top line revenue growth comes from the nominal level of growth in the world economy. Nominal world GDP is a good guideline for top line numbers. However, one caveat to think about is the reporting currency. It has a huge impact on the top line once foreign revenues are converted back to U.S. dollars.
Our chart shows the annual world nominal GDP numbers (US$) overlaid with the monthly U.S. dollar index (level of U.S. dollar versus its major developed world trading partners). About half of the S&P 500 revenues come from abroad, so currency fluctuations have a huge impact on top line revenue growth.
When we look at the sector breakdown, technology stands out, alongside energy and materials. The late cycle inflation pressure we are seeing is playing out in the commodities space, but recent downturns in copper and other base metals suggests that the materials sector may have its best returns in the rear view mirror. Energy, too, may have seen the best of its gains. We will need to listen closely to what companies are telling us about trade impact along with rising interest rates on a go-forward basis. The amount of leverage corporate America has put on the books will have a big impact on the bottom line.
SECTOR BREAKDOWN
| Sector | Q2/18 | FY18* | FY19* | FY20* |
|---|---|---|---|---|
| Forecast Sales per Share($)** | 323.11 | 1,293.40 | 1,358.40 | 1,417.90 |
| S&P 500 Index Growth | 8.01% | 7.84% | 5.10% | 4.55% |
| S&P 500 Ex-Financials | 8.71% | 8.45% | 5.08% | 4.64% |
| S&P 500 Ex-Energy | 6.74% | 6.96% | 5.18% | 4.89% |
| Consumer Discretionary | 8.80% | 8.60% | 6.50% | 6.40% |
| Consumer Staples | 4.00% | 4.60% | 3.50% | 3.50% |
| Energy | 21.60% | 17.10% | 4.30% | 1.20% |
| Financials | 3.30% | 3.80% | 5.20% | 4.00% |
| Real Estate | 8.00% | 9.60% | 5.00% | 8.10% |
| Health Care | 6.40% | 6.90% | 5.40% | 5.10% |
| Industrials | 7.40% | 7.60% | 5.20% | 4.70% |
| Information Technology | 12.50% | 12.70% | 7.30% | 6.70% |
| Materials | 13.50% | 10.30% | 2.90% | 3.70% |
| Telecom | 2.30% | 2.70% | 1.30% | 2.50% |
| Utilities | -0.80% | 0.70% | 2.10% | 2.10% |
Markets should be less focused on trade and more focused on earnings in the coming weeks. If the S&P 500 cannot make new highs in the next month or so, odds of a major bull market top already in place increases significantly as the Fed slows things down and the U.S. dollar strengthens.
Follow Larry Online:
Twitter: @LarryBermanETF
LinkedIn Group: ETF Capital Management
Facebook: ETF Capital Management
Web: www.etfcm.com


