Jul 19, 2021
Larry Berman: Market breadth indicators suggest trend is weakening into poor seasonal patterns
By Larry Berman
Larry Berman: Market breadth weakness emerges
VIDEO SIGN OUT
The greater the number of stocks participating in the trend is bullish. There is no debate about it. When fewer larger stocks are lifting markets, the signal is that of a later stage more defensive rally (buy big safe blue-chip quality stocks). This does not mean you need to panic. It suggests that once a (bearish) catalyst is present, the odds that market sees a normal (5-10 per cent) correction is high. I recall saying this years ago and a viewer sold their entire portfolio. DO NOT DO THAT, I MIGHT BE WRONG, I WAS BACK THEN. A 5-10 per cent correction on average happens at least once per year. In most cases these are opportunities. But the correction might be 4 per cent or it might be 15 per cent. This part is impossible to know or forecast with any certainty. We can only look to where support should be as an expectation of where opportunity lies.
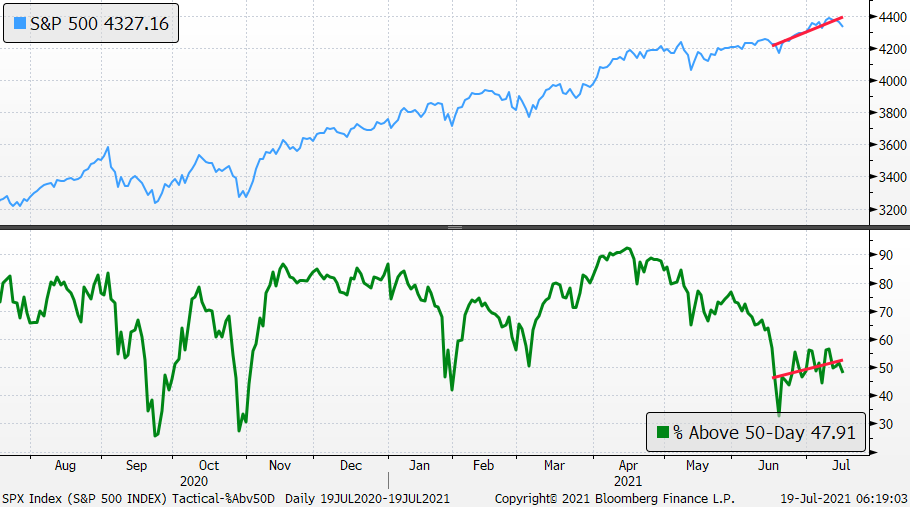
Currently, the most glaring breadth weakness is seen in one of our PRO-EYEs tactical indicators: The Percentage of S&P 500 stocks above their own 50-day average.
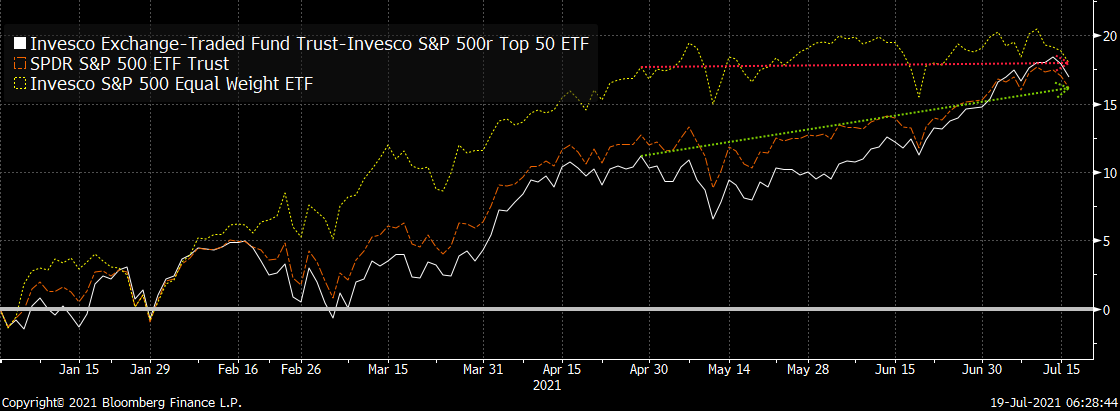
When we look under the hood, we can see the RSP (Equal weight S&P 500) has mostly moved sideways since the end of April when the S&P 500 first hit 4200 and our Pro-EYEs indication flashed strong cautionary signals. The May dip was very modest. The recent rally in June and July that took the S&P 500 from 4200 to almost 4400 was primarily the largest companies doing the lifting. The chart below shows the XLG (Invesco top 50 of the S&P 500) ETF. Year-to-date, the average stock in the index is up almost 17.94 per cent with the top 50 up 16.91 per cent and the overall index ETF SPY up 16.13 per cent (all including dividends). For most of the year, there has been a fierce rotation with money moving from the large stocks to the average stock on reopening hopes and then back again as markets get concerned about growth.
On July 14, 429 stocks in the S&P 500 declined while the S&P 500 fell just 0.4 per cent, the S&P's largest number of decliners for a drop that small in 25 years.
Check out our weekly update in our PRO-EYES - Berman's Call macro indicators each week to help figure out when it may be time to be cautious or when it may be time to be opportunistic. The indicator is designed to work like the CNN Fear and Greed index looking for extreme market conditions. CNN’s index is not extreme. The recent PRO-EYEs readings suggest tactical risks are rising for Q3 with extreme valuations supported by central bank liquidity. We expect the FOMC could make a policy mistake if they are too aggressive in tapering. Our tactical indicators are showing a modest degree of caution with seasonality quickly becoming a headwind with some complacency in the volatility curve.
| Tactical Factor: | Std. Dev. | Level of Caution |
|---|---|---|
| 5-Day Put/Call Ratio | 1.39 | 92% |
| Speculative Position S&P 500 Futures | 0.54 | 71% |
| Percentage Deviation from 200-Day Moving Average | 1.12 | 87% |
| AAII Bull vs. Bear Sentiment Spread | 0.16 | 56% |
| Seasonal Pattern (All Years) Since 1928 | 0.68 | 75% |
| Presidential Cycle (Current Year) Since 1928 | 0.67 | 75% |
| Current vs. Average Volatility (VIX) | -0.25 | 40% |
| Current vs. Future Volatility (VIX) | 0.64 | 74% |
| Percentage of S&P 500 Holdings Above 50-Day Average | -0.64 | 26% |
| Percentage of S&P 500 Holdings Above 200-Day Average | 1.13 | 87% |
| Breadth-McClellan Summation Index | -0.05 | 48% |
| Overbought-Oversold 13-Week Relative Strength Index | 0.78 | 78% |
| Total Tactical Factor: | 67% |
A tactical reading above 70 per cent historically suggests correction risks in markets are elevated. A reading of over 75 per cent for the overall index suggests that returns in the next 3 months are on average down about 7 per cent. The index has been in this condition since late April when we saw the average stock peak and start to move sideways. The more speculative elements of the markets have performed poorly since then.
Follow Larry online:
Twitter: @LarryBermanETF
YouTube: Larry Berman Official
LinkedIn Group: ETF Capital Management
Facebook: ETF Capital Management
Web: www.etfcm.com
 in New York, U.S., on Thursday, Dec. 27, 2018. Volatility returned to U.S. markets, with stocks tumbling back toward a bear market after the biggest rally in nearly a decade evaporates. Photographer: John Taggart/Bloomberg, Bloomberg")


