Mar 22, 2021
Larry Berman: Seasonality and stimulus supportive for Q2
By Larry Berman
Global demographics key indicators of where to invest: Larry Berman
First and foremost: This week marks the 14th anniversary of Berman’s Call on BNN Bloomberg. Thank you!
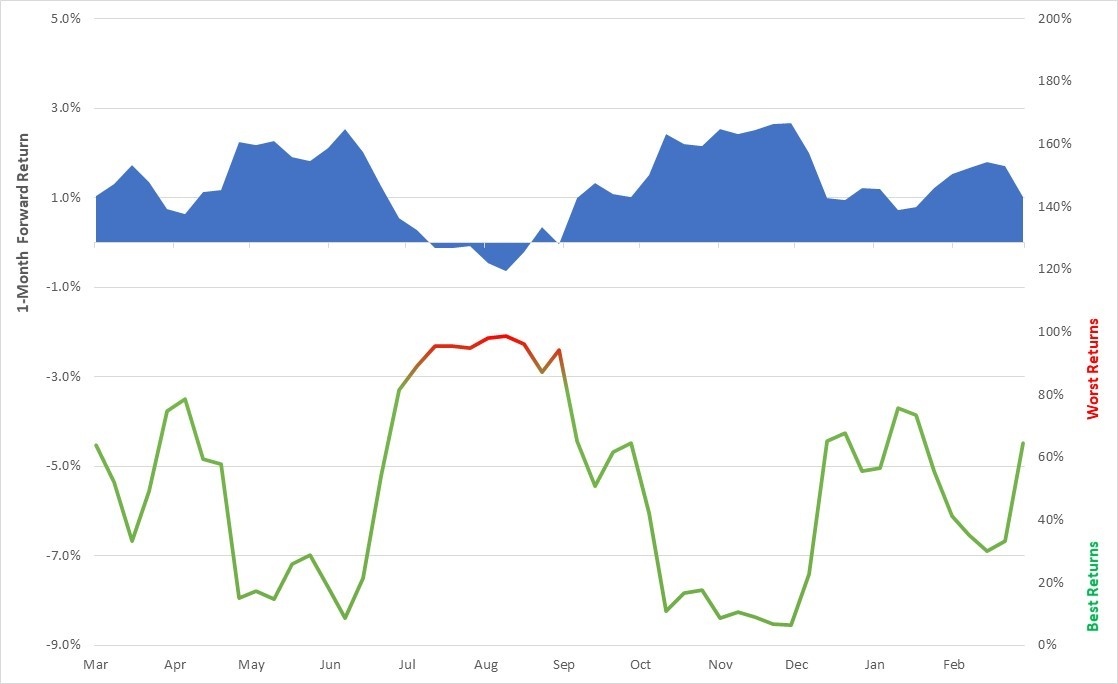
Now on to business… Seasonality patterns show expose longer-term historical biases in the markets. There is no guarantee these work every year, but when we combine seasonal factors with other non-related factors like the recent US$1.9-trillion stimulus package passed by U.S. Congress, some support for seasonal bias appears, raising odds that it plays out.
The chart below shows seasonal patterns for every year since 1927. It’s clear that the third quarter presents the biggest challenge for markets historically, meaning the next few months could well show some of the best seasonal patterns of the year. It’s also wise to look for a catalyst for seasonal patterns to dominate… This year we seem to have a good one.
S&P 500 Seasonal Patterns 1927-2020
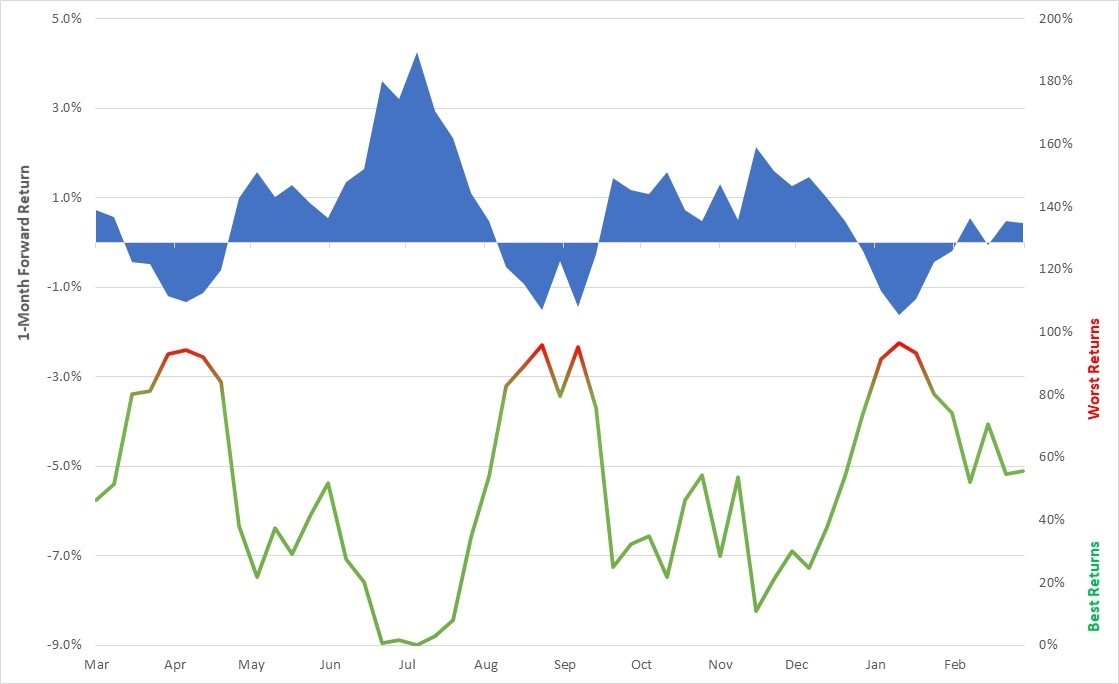
Seasonal patterns suggested that the first quarter would likely show weakness in the first year of a presidential cycle (as shown in the next chart). But the reasons for the weakness have very little to do with typical historical causes. This time around it was about rising bond yields. In most years (at least every fourth year), it is just a cooling after the election results rally and then some uncertainty around the new administration. The first stimulus bill was done via reconciliation, and that could power some negative implications for Congress in the mid-terms in November 2022.
S&P 500 Seasonal Patterns 1927-2020 (first year of presidential cycle)
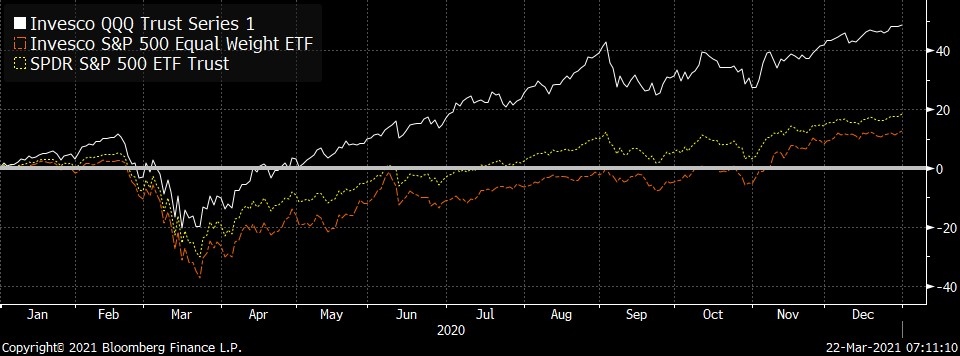
I had suggested late last year that the post-COVID recovery trade would see the average stock – as represented by the RSP S&P 500 equal weight ETF beat the broader S&P 500, as represented by the SPY ETF. The chart below clearly shows that big cap technology – represented by the QQQ Nasdaq 100 ETF - has been the weight on the overall market. On a year-to-date basis, the QQQ has seen no gains. For the broader S&P 500, it was similar until a few weeks ago. The average S&P 500 stock is now up 10 per cent this year.
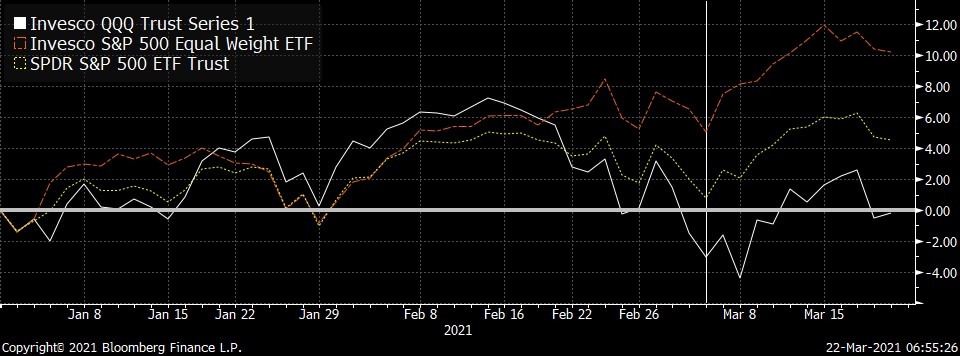
Looking at 2020 with perfect hindsight, the average stock (RSP) was up 12.7 per cent while the QQQ was up a staggering 48.6 per cent. In my view, there’s a high probability big cap tech goes nowhere for the next year, while the average stock plays some catch up. Antitrust legislation is bound to be in the cards for the likes of Facebook Inc., Amazon.com Inc., and Alphabet Inc’s Google, providing a bit of a headwind while the average stock gets a bump from economic re-opening.
Looking forward, the best earnings upgrades are not likely coming from what did well last year but from what did not. Consensus bottom-up analyst expectations for the S&P 500 Index is at an average of US$175, and the average earnings report starting in mid-April is expected to be encouraging, given stimulus and vaccine success. That estimate could get upgraded to about $180.
Here is where the support from low interest rates and rising inflation gets complicated. As long as rates stay low, Big Tech should be okay; growth companies are considered very long-duration assets. If rates keep rising, however, Big Tech will likely continue to weigh on the market and the S&P 500 will have trouble holding an elevated multiple.
Remember, the long-term price-to-earnings multiple is about 16-to-17-times-EPS. Currently, the S&P 500 is trading at 22.4-times forward expectations - the $175 number mentioned above. If the multiple holds through first-quarter earnings, that could see an overall S&P 500 target of 4,032 ($180 x 22.4). Furthermore, if rates fall a bit and big-cap tech rallies too, the market could challenge the end-of-2022 target of 4,480 ($200 x 22.4). There is a good chance the highs for the year come in the next few months.
These bullish scenarios have huge leverage to the bond market and how the Fed chooses to navigate it. But, after we get through first-quarter earnings, the U.S. will have to pay for the stimulus and that will require about US$2 trillion in new debt issuance. Who is going to buy it?
If the Fed does not step up their purchases, then we likely see rate pressures and the multiple goes to 20 x $180 and suggests the S&P 500 will be closer to 3,600, which is much closer to where I think it will finish the year.
So much depends on the FOMC and their ability to keep the party going. They seek more inflation, but higher rates likely kills the multiple. Powell is speaking three times this week to clarify last week’s message. For now, seasonality is a positive factor.
This week in our weekly (back to Thursday) Spring 2021 Berman’s Call virtual roadshow we will take a deep dive on factor based (including market cap vs. equal weight and value versus growth) ETF opportunities. Register a www.etfcm.com or at www.investorsguidetothriving.com. The format this series will be a 30-40 minute weekly presentation that changes each week to current market developments and a 30-40 minute Q&A.


