Dec 14, 2020
Larry Berman: Seasonality in Biden's first year could surprise euphoric investors
By Larry Berman
Seasonality patterns in presidential cycle that could surprise investors: Larry Berman
VIDEO SIGN OUT
The next indicator in my PRO-II (Pro-Eyes) series looks at seasonality patterns. Like many indicators, they tend to be relatively short-term in nature and scope. Seasonality is one such indicator.
This can be helpful for tactical trades or timing potential entries into expected periods of weakness. You have probably heard of the “Sell in May and go away” seasonal pattern. It stems from the period of weakness we tend to see in May and September. But there are significant differences in seasonal patterns based on how U.S. markets react to each four-year presidential term.
The fixed schedule of U.S. elections sets up spending patterns for Congress as the fixed schedule influences budgeting decisions. We are seeing this now as both U.S. parties eye the Georgia Senate races. Should the Democrats win both seats in January’s run-off elections, they will be able to spend more in the next two years than if the GOP retains control of the Senate. The difference between what happens in an average first quarter and the first year of a presidential cycle is significant and may surprise many investors. For now, the year-end Santa Claus rally - after the pending index rebalancing on Dec. 21 - is a clear positive.
The PRO-II cycle chart averages go back to 1927 for U.S. large cap equities.
This chart looks at the one-month forward price return of the index. You can see based on today’s reading, we have a very strong seasonal period into yearend.
Seasonal patterns S&P 500 one-month forward returns
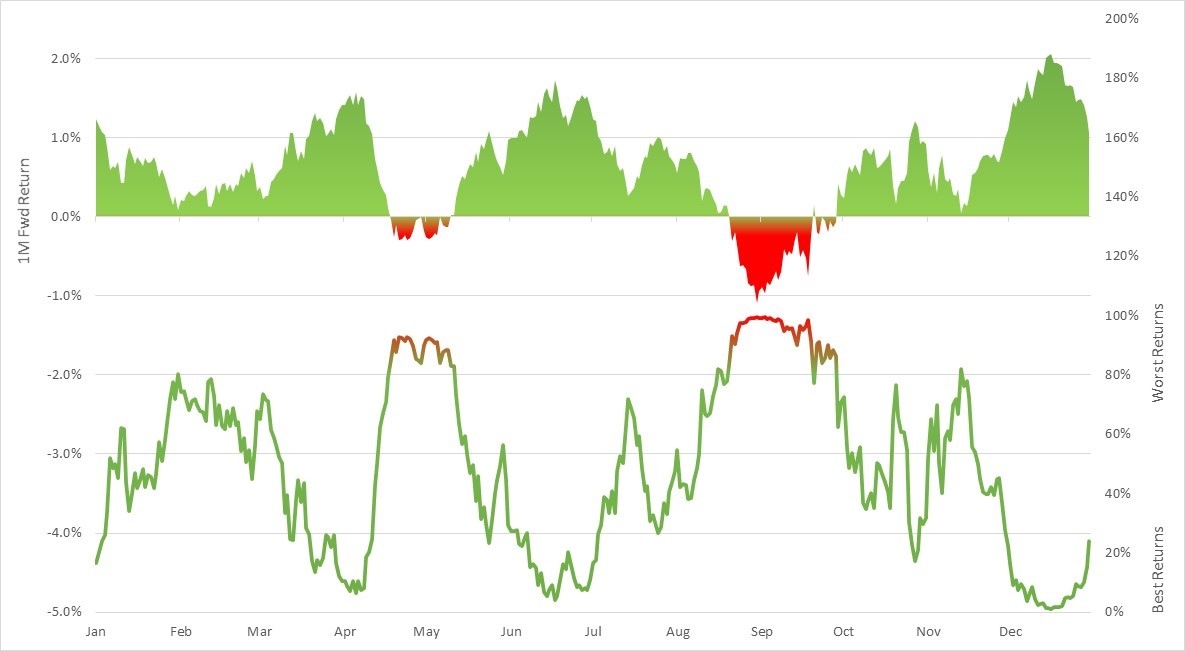
History suggests that the market is at risk for a correction in the first quarter of 2021.
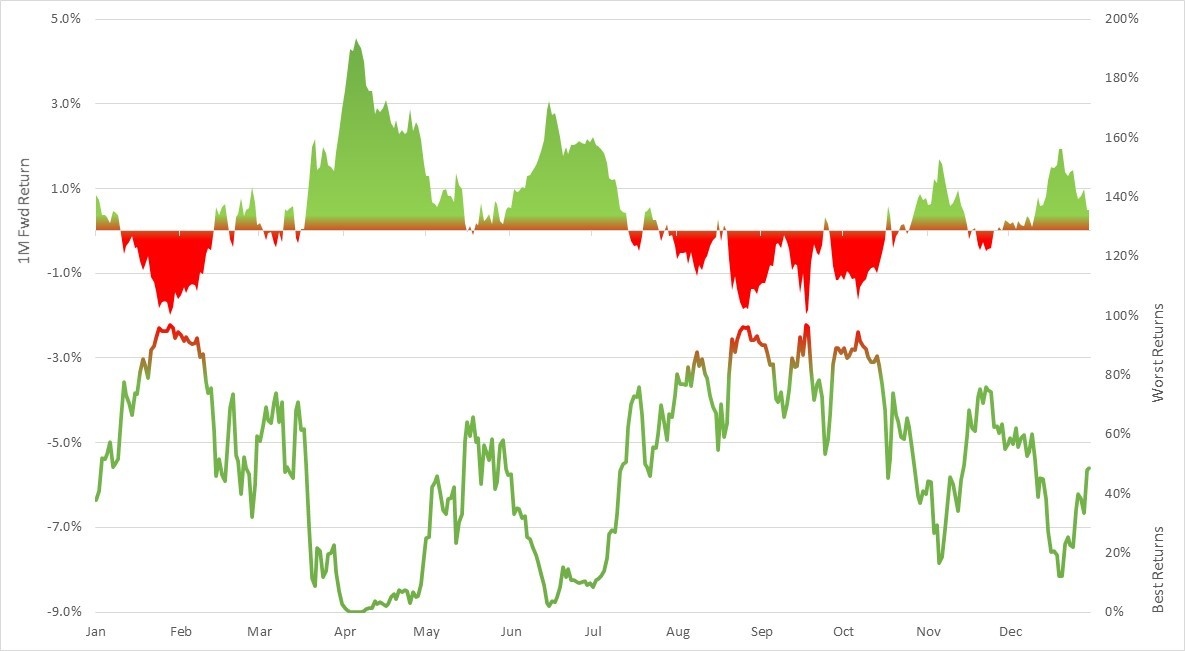
No guarantee here, but if you are looking for an entry location, some time in February might be the most likely. The indicator suggests not only when it could happen, but a bit about how long it might last and on average how deep it might go. However, these are averages. It does not happen all the time and the magnitudes vary significantly. These are tendencies, not certainties.
Part of the pattern differentiation in the first year of a presidential term is the result of uncertainty. Perhaps timing on implementing new policies results in some trepidation in the market. On average, year one is the weakest year of the four. But 2017 was a huge year for the markets under Donald Trump, so clearly it is not always true. But that followed two relatively bad years in 2015 and 2016. Based on what happened in 2020, this indicator argues 2021 may be average at best.
Seasonal patterns - S&P 500 one-month forward returns (average first year of a presidential term)
Look for more in the coming weeks from our new Berman’s Call Probable Return on Investment Index, PRO-II (pronounced Pro Eyes) Indicator. We will be launching the new website in early January so that BNN viewers can follow along with the various risk and opportunity factors we follow.
Follow Larry online:
Twitter: @LarryBermanETF
YouTube: Larry Berman Official
LinkedIn Group: ETF Capital Management
Facebook: ETF Capital Management
Web: www.etfcm.com


