Jun 25, 2018
Larry Berman: The best long-term indicator of market returns and what it's saying now
By Larry Berman
 in New York, U.S., on Monday, Dec. 19, 2016. A cautious tone spread through financial markets as the last full trading week in 2016 began. , Bloomberg News")
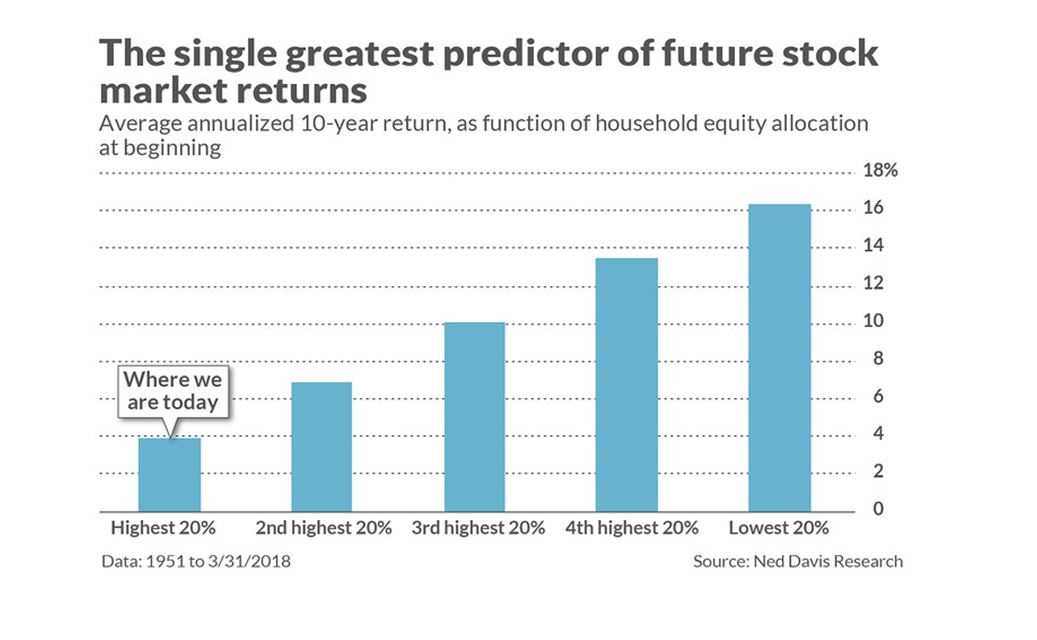
According to Mark Hulbert of Financial Digest fame, a sentiment-based independent based analyst firm, the single best (long-term 10 years) predictor of future returns is equity share of household assets. These data can be followed (annually) on the Federal Reserve Board of St. Louis (FRED) economic indicators database. The chart today is courtesy of Ned Davis Research, one of the top independent market research firms in the world.
The forward 10-year return based on how much equity households own in the stock market. We are currently in the top 20 per cent historically (since 1951) and that suggests returns over the next decade will be significantly lower than average.
When the statistics are run on several longer-term forecasting methods, the highest correlation to the forward 10-year return is seen by this indicator. The rational is when everyone owns equities, there are no more buyers left to buy. Other methods offer good longer-term predictions too. The overall size of the market compared to the economy is second best, and the long-term smoothed (cyclically adjusted) P/E ratio (Shiller) is also quite good. Just looking at the most recent 12-month trailing P/E is not better than a coin flip when looking down the road at returns.
LONGER-TERM FORECASTING
| Correlation |
Household equity allocation |
Market Cap to GDP | Shiller CAPE Ratio | P/E trailing 12 mths |
|---|---|---|---|---|
| R-Squared | 0.91 | 0.76 | 0.66 | 0.50 |
This does not mean you run out and sell everything, but it tells you that for the next decade, buy and hold returns are not likely going to give you the experience you are hoping for. And while I advocate for using passive ETFs to build portfolios, I complement the passive indexing approach with active tactical asset allocation to reduce risks and enhance returns.
Follow Larry Online:
Twitter: @LarryBermanETF
LinkedIn Group: ETF Capital Management
Facebook: ETF Capital Management
Web: www.etfcm.com


