Incomprehensible! It is almost like it never happened. How can the market just look past the biggest economic shock in history like it never happened? Is the central bank printing press that powerful? Is it bullish that the central bank needs to monetize debt going forward because governments have been poor stewards of our tax dollars?
I think not, but perhaps I am in a small minority of investors that simply do not care why the markets are going up… only that they are going up. To me, the quality of a rally and the real fundamentals matter in the long run. In the short run, markets tend to be emotional and somewhat irrational. That is the most difficult part of forecasting markets. I think the “why” matters.
The daily bottom-up analyst survey conducted by Bloomberg now shows that analysts expect about US$125 in earnings-per-share (EPS) for 2020 and a V-shaped recovery to US$161 in 2021 (about 6 per cent higher than the 2019 actual).
With 40 per cent of companies suspending guidance, we can not know what earnings will be. This group of grossly overpaid forecasters (I know, I used to be one of them) did not take their earnings numbers down until a few weeks ago. And most of them need to hear the companies’ guidance to have any clue where earnings might be.
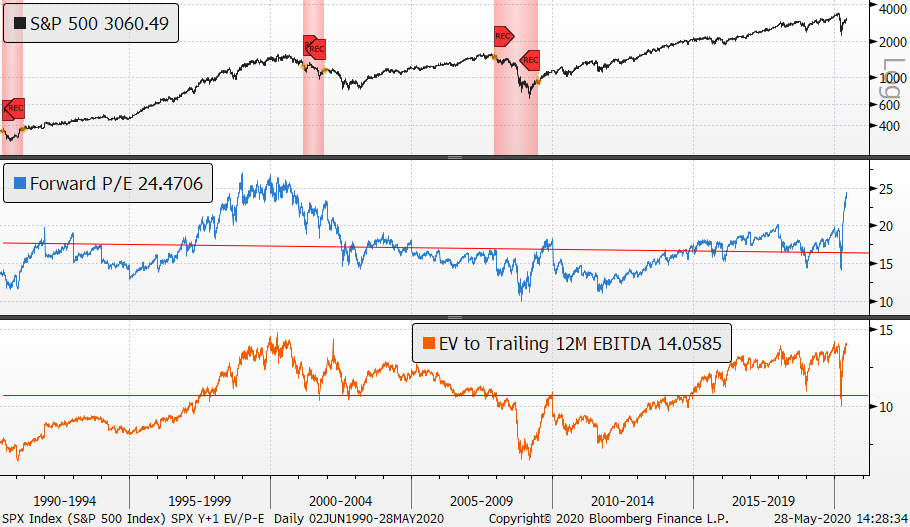
Traditional metrics compare price to earnings, sales, book value, dividend yield and enterprise value (the amount of capital utilized in equity and debt) to determine levels of profitability. These include: Price-to-earnings on a forward basis, enterprise value to EBITDA (earnings before interest, tax, depreciation, amortization), how much debt and equity have been issued to generate revenues, and operating income. Bloomberg holds about 30 years of data, which now includes a fourth recession. At the trough of the recessions, these metrics are not elevated as they are now.
For the 23 Dow Jones Industrials companies reporting non-GAAP (generally accepted accounting principles) EPS so far, the median difference between non-GAAP and GAAP was 12.4 per cent. The thing is, the earnings numbers for the S&P 500 above are not GAAP, they are made up numbers excluding “one-time” items and sometimes stock-based compensation. The markets are grossly overvalued on a non-GAAP basis. On a GAAP basis, it is the most expense ever … there is no other way of saying it.
Another metric of valuation is using a discounted cash flow based on the risk-free government bond rate. Typically, they use the 10-year government rate currently around 0.70 per cent. On this basis, the market is not grossly overvalued. It is just a bit overvalued. However, no corporations can borrow at the risk-free rate. Their cost of money (the interest they deduct from income) is much more expensive. The average credit rating for the S&P 500 is BBB one notch above junk status. The BBB yield that the average corporation is borrowing at is 233 basis points above the government rate or a bit over three per cent. And that is only because the Federal Reserve is now buying them.
S&P 500 Income ($B)
S&P 500 Profit Margins
Looking at where these index profits and come from, it is evident that many sectors contribute very little, and some quite a bit. The six largest tech stocks (Facebook, Apple, Amazon, Netflix, Alphabet and Microsoft) is almost 15 per cent of the income in the entire market. Health care (15 per cent of S&P 500), technology (26 per cent) and communications (10.9 per cent) make up close to 60 per cent of income. The most profitable sector is technology (REITs have special tax status) which is one of the main reasons the markets look better than they really are under the hood. Going into the last recession, energy was the largest group in the index. Today it is less than three per cent.
Looking at the trends of the past few years, the big jump higher in 2018 was a result of U.S. President Donald Trump’s tax cuts. Beyond that, and financial engineering, we have not seen any real growth in earnings or profitability in seven years.
So, how is that bullish?
Advertisement