Feb 1, 2021
Larry Berman: What does market breadth tell us about when to 'buy the dip'?
By Larry Berman
Larry Berman: Keeping an eye on moving averages
VIDEO SIGN OUT
All my valuation models are still off-the-charts extreme, which means that longer-term, forward-based returns are likely well below average and correction risks are elevated. Economic conditions overall are supported by massive expectations for more stimulus and central bank support.
This could, and maybe should, last into 2022, but you can already see that massive stimulus is getting bipartisan pushback. There is also a funding problem. The U.S. Federal Reserve is not buying enough and that can hurt inflated asset markets.
You can’t be bullish about this, but it can continue to support the economy for as long as it lasts, and it has thus far.
Tactical indicators are mixed. We’ve seen a huge volatility spike - which historically marks a buying opportunity - and sentiment readings from the American Association of Individual Investors is now neutral between bulls and bears from extreme readings last month. These factors have reduced the tactical risk factors.
So, the markets have come off the more extreme readings of a few weeks ago, but seasonal patterns remain bearish for February and volatility is expected to remain elevated, as policy uncertainty is rising. There was also a notable decay in market breadth in January.
Market breadth indicators do not indicate how far a market can fall, or how long it could last, but they do provide some indication on when to look for a bottom. The below chart looks at the percentage of stocks in the S&P 500 above the 50- and 200-day averages. It shows that in January, more than half of the S&P 500 stocks broke below their own 50-day averages, but the percentage of stocks above their own 200-day averages is still very high.
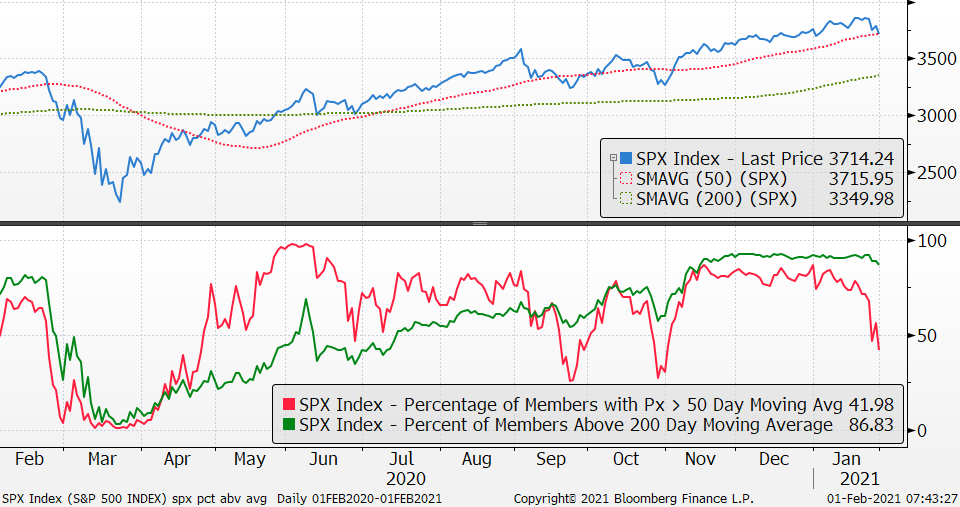
In past corrections this number has tended to moderate much more. The rising 200-day average (3350) for many stocks becomes the target once the 50-day average breaks. The S&P 500 closed right on the 50-day average, closing the month at 3,715. By the end of February, that rising 200-day average is likely in the low 3,400’s. A close below the 50-day average for the S&P 500 would likely see momentum sellers pick up the pace.
Look for more in the coming weeks from our new Berman’s Call Probable Return on Investment Index, PRO-II Indicator. We will be launching the new website soon so that BNN viewers can follow along with the various risk and opportunity factors we follow.
Follow Larry online:
Twitter: @LarryBermanETF
YouTube: Larry Berman Official
LinkedIn Group: ETF Capital Management
Facebook: ETF Capital Management
Web: www.etfcm.com
 in New York, U.S., on Monday, Jan. 4, 2021., Bloomberg")


