Jan 25, 2022
Nasdaq Composite’s Wild Swing Precursor to Bounce, History Shows
, Bloomberg News

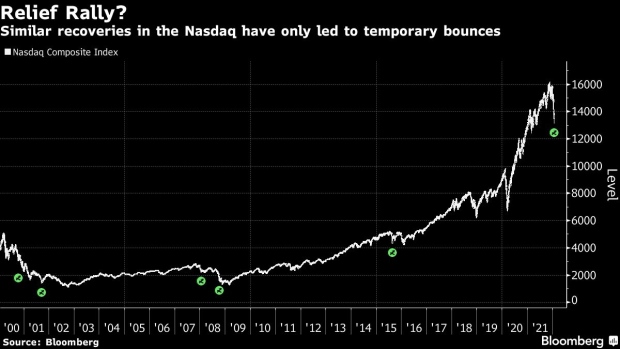
(Bloomberg) -- The Nasdaq Composite Index’s gain on Monday after an intraday plunge of nearly 5% was only the sixth time this century that a swing of that magnitude occurred. Each instance led to a rather sharp recovery within the prevailing downtrend.
Trading data analyzed by Bloomberg shows that in the other five sessions since 2000 that saw the Nasdaq Composite close in the green after reversing a drop exceeding 4%, the decline came to a stall and a sharp rally ensued for a few days to a few weeks.
The trading session in the U.S. on Monday “had a feel of short-term capitulation,” Thomas J. Hayes, chairman of Great Hill Capital in New York, said in emailed comments. The key signals for a “tradable bottom to be confirmed” will come from earnings of technology companies and some market-friendly Federal Reserve guidance on balance-sheet reduction, he said.
The first two instances of same-session recovery of more than 4% came in the midst of the dotcom bubble from 2000 to 2002. The next pair appeared around the Great Recession in 2007 to 2009. The most-recent before Monday’s event occurred during the so-called correction from 2015 to 2016, the Bloomberg data show.
The technical indicators that all instances share -- in addition to the substantial intraday recovery -- include a daily relative strength index reading below 30, a bearish prior candle with close below the day’s open and a bullish candle on the signal day, or Monday in the latest case. A candle refers to the trading range in a specific period.
Excluding the latest occurrence, the Nasdaq Composite was up an average of 3.5% after five days -- with the index also higher in all five instances. The mean gain after 20 days widened to 5.2%, with the benchmark higher in four of five cases.
©2022 Bloomberg L.P.