Dec 15, 2017
Personal Investor: Is your debt treadmill out of control?
By Dale Jackson

Household debt has hit a new high, or low, depending on how you look at it. Statistics Canada says we owed $1.71 for every $1 we brought in last quarter.
To put that in perspective, back in the 1990s we earned more than we owed. It was a simpler time.
It’s raising alarm bells on Bay Street where the big banks worry about the good people of Canada keeping up their payments. After all, that’s what the debt-to-income benchmark is all about – debt serviceability. The actual debt levels are our problem. In fact, growing household debt is what fuels those big holiday bonuses. It’s when the income can’t keep pace that the banks – and the economy – suffer.
Think of the debt-to-income measurement as a treadmill. Our income is the physical energy we can exert when we run to keep up with the momentum of the treadmill, which is our debt and the interest it accumulates over time.
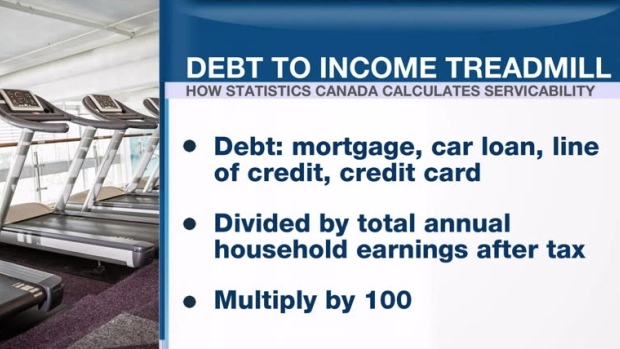
You can determine your own debt-to-income ratio with a simple calculation: add up your debt (includes your mortgage, car loan, line of credit, credit card and whatever you owe), divide it by total annual household earnings after tax, and multiply by 100.
Don’t panic if it’s higher than the national average and don’t celebrate if it’s low – at least not yet.
The debt-to-income ratio does not distinguish good debt from bad debt. For example, a young household with modest income and a big mortgage could have a debt-to-income ratio of 300. That seems bad but the mortgage debt is probably accumulating at about 2.5 per cent each year and the household has plenty of time to pay it down and build equity in the home. In addition, the young household likely has bigger income years ahead to accelerate the drive to a lower debt-to income ratio.
At the other end of the scale, a high-income household nearing retirement with no equity in a home and credit card debt could post a debt-to-income ratio of 30. That credit card debt is probably accumulating interest at 18 per cent each year and when retirement comes, income will probably fall. That’s trouble.
A more accurate measure of debt on a household level is debt-to-assets: everything you own (assets) versus everything you owe (liabilities). The debt burden for younger households could seem overwhelming at first but over time, as assets grow and debt falls, they will be outrunning their treadmills and sitting pretty.