May 28, 2021
The Number of People Who Say It’s a Good Time to Buy a House Has Collapsed
, Bloomberg News

(Bloomberg) -- Here’s your chart of the day.
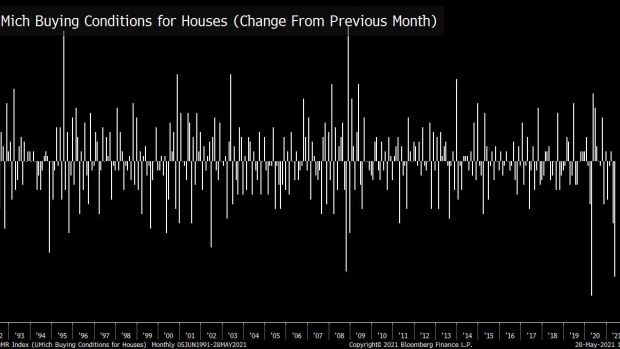
From Friday’s University of Michigan economic sentiment survey, check out the long term chart among survey respondents who say now is a good time to buy a house.
It’s at the lowest level in over 30 years, as everyone now knows how expensive they are, all the bidding wars, and delays and everything else. Staggering chart.
If you look at the sequential change, this was the second-biggest monthly plunge ever. The only other time it dropped like this in one month was last March for obvious reasons (although, in retrospect, that would have been a great time to buy one).
One more interesting housing chart is if you look at selling conditions, they’re through the roof. It’s a great time to be selling a house (yellow line). Back in 2005 and 2006, you’ll note, the two lines declined at roughly the same time.
And finally, it’s not just housing where buyers are deciding to sit out. Here’s the long-term chart on vehicles. Also collapsing, amid surging used-car prices and limited production capacity of new vehicles due to semiconductors.
It’s the market at work. Shortages and higher prices causing disillusionment among buyers, which, well, should eventually ease the shortages and higher prices.
©2021 Bloomberg L.P.


