{{ currentBoardShortName }}
  • Markets
  • Indices
  • Currencies
  • Energy
  • Metals
Markets
As of: {{timeStamp.date}}
{{timeStamp.time}}

Markets

{{ currentBoardShortName }}
  • Markets
  • Indices
  • Currencies
  • Energy
  • Metals
{{data.symbol | reutersRICLabelFormat:group.RICS}}
 
{{data.netChng | number: 4 }}
{{data.netChng | number: 2 }}
{{data | displayCurrencySymbol}} {{data.price | number: 4 }}
{{data.price | number: 2 }}
{{data.symbol | reutersRICLabelFormat:group.RICS}}
 
{{data.netChng | number: 4 }}
{{data.netChng | number: 2 }}
{{data | displayCurrencySymbol}} {{data.price | number: 4 }}
{{data.price | number: 2 }}

Latest Videos

{{ currentStream.Name }}

Related Video

Continuous Play:
ON OFF

The information you requested is not available at this time, please check back again soon.

More Video

Jul 27, 2018

Twitter's post-earnings rout shatters two key technical levels

The Twitter Inc. logo is seen behind an Apple Inc. iPhone 6s displaying the company's mobile application in this arranged photograph taken in New York, U.S., on Tuesday, Feb. 9, 2016.

Security Not Found

The stock symbol {{StockChart.Ric}} does not exist

See Full Stock Page »

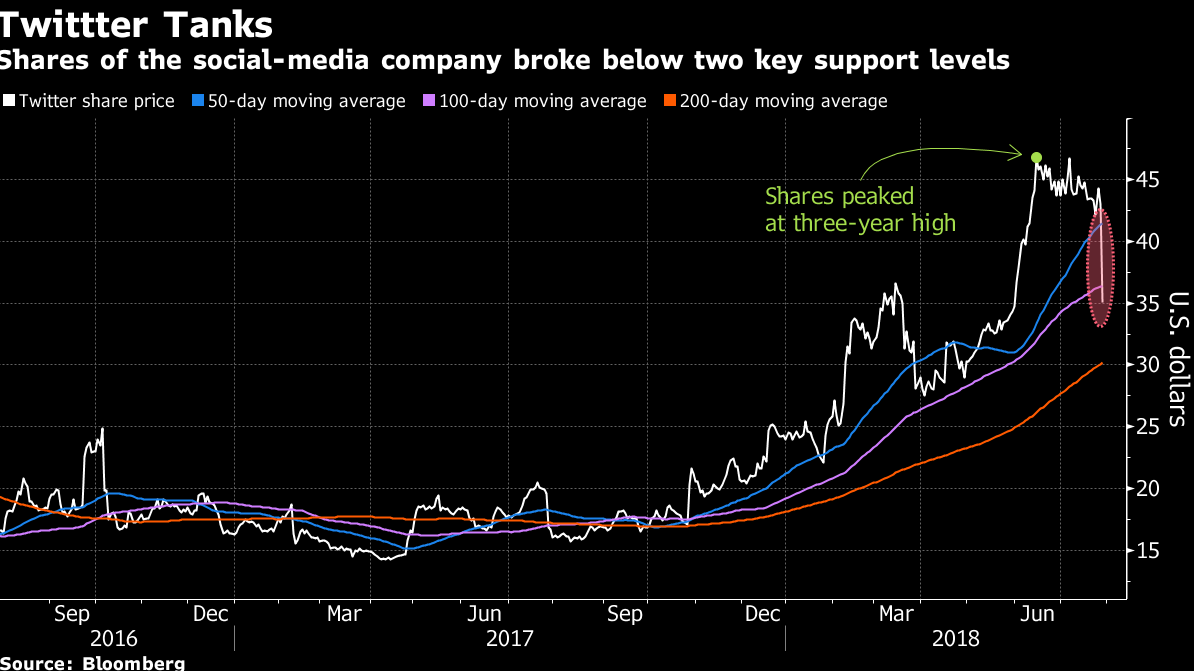
Twitter Inc.’s shares are trading below their 50- and 100-day moving averages for the first time in almost a year as the company’s second-quarter earnings report showing that user growth is flat-lining triggered the biggest plunge since 2016.

A second-quarter earnings report that showed fewer people using the company’s microblogging website as it aggressively moves to eliminate fake and suspicious accounts pushed the shares down as much as 19 percent. Volume was more than four times the 30-day average.

Prior to today’s rout, Twitter’s share price had held above the 100-day moving average since October 2017. The 50-day line had been a support level since early May.

Embedded Image