Last week I discussed the extreme bullish readings in the American Association of Individual Investors (AAII) sentiment survey. Statistically, the difference between the bulls and the bears was at the 95 per cent confidence interval. Historically, this marks an extreme condition and, on average, the probability of return over the next year tends to be well below average. The odds of a more-than-10-per-cent correction increase significantly. The theory here is that with most investors saying they are bullish, they are likely already in the market and there is not much cash left to buy. If far more investors are bearish, they are likely in cash and have lots of buying power.
This week I am looking at mean (trend) deviation. There are many factors that make up my new Berman’s Call Probable Return on Investment Indicator (PRO-II, or Pro Eyes). The origin of the indicator stems from my CMT thesis paper that I wrote 25 years ago. It was initially written to track the bond market and I’ve modified it for equity markets. It’s a combination of fundamental and technical indicators that provide a probability score for the market rallying or declining. Many may remember that I was the fixed-income strategist for CIBC World (Capital) Markets when I first started as a guest on Market Call over 20 years ago.
I have been following the CNN Fear and Greed Indicator for many years and it has done a very good job telling investors when to be cautious or aggressive on markets. I like to call it a buy-low/sell-high indicator rather than fear and greed. I think the emotional influence on investment decisions need to be minimized, and fear and greed are the epitome of emotions in my view. Last week the CNN indicator entered the extreme greed range at 91/100. The CNN gauge is very good, but it lacks a few elements that my indicator includes, which provides some differences in technical indicators too.
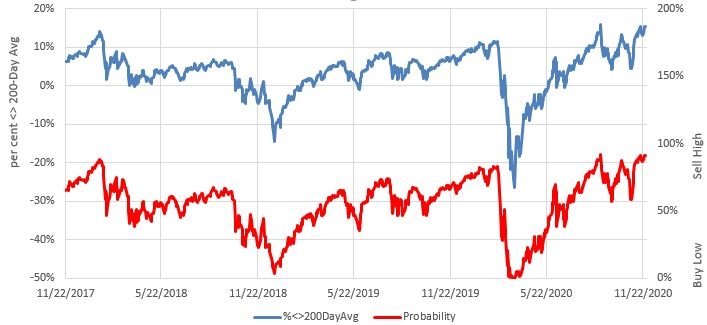
In terms of trend-following and when it hits an extreme, CNN looks at the difference between the price of the S&P 500 and the 125-day moving average (approximately six months of trading days). I like the 200-day average for the simple fact that there are so many eyeballs on it and I’ve observed that over the years it tends to act as a meaningful pivot point for many investors. My chart today shows the indicator value over the past few years, including the highs and lows in 2018 through today.
The statistics around the trend-deviation element of the indicator are interesting. Like the CNN indicator that uses 125 days, a reading over 90 per cent since 1928, suggests that in the next 200 days, the probability of a 10-per-cent correction is significantly higher.
Each week for the rest of the year I will look at another factor and the indicator will be formally launched and published in early 2021 on the BermansCall.com blog.
Don’t miss the final Berman’s Call virtual roadshow on Thursday Dec. 3 at 7 p.m. ET where we will be showing more of the elements in our new PRO-II Indicator. If you missed one, you can see all the replays here. Sign up for the series at www.etfcm.com. There will be lots of opportunity to ask questions of markets and your favourite ETFs and stocks.
Follow Larry online:
Twitter: @LarryBermanETF
YouTube: Larry Berman Official
LinkedIn Group: ETF Capital Management
Facebook: ETF Capital Management
Web: www.etfcm.com
Advertisement