Apr 17, 2019
Currency traders should get ready for a big move in the U.S. dollar
, Bloomberg News

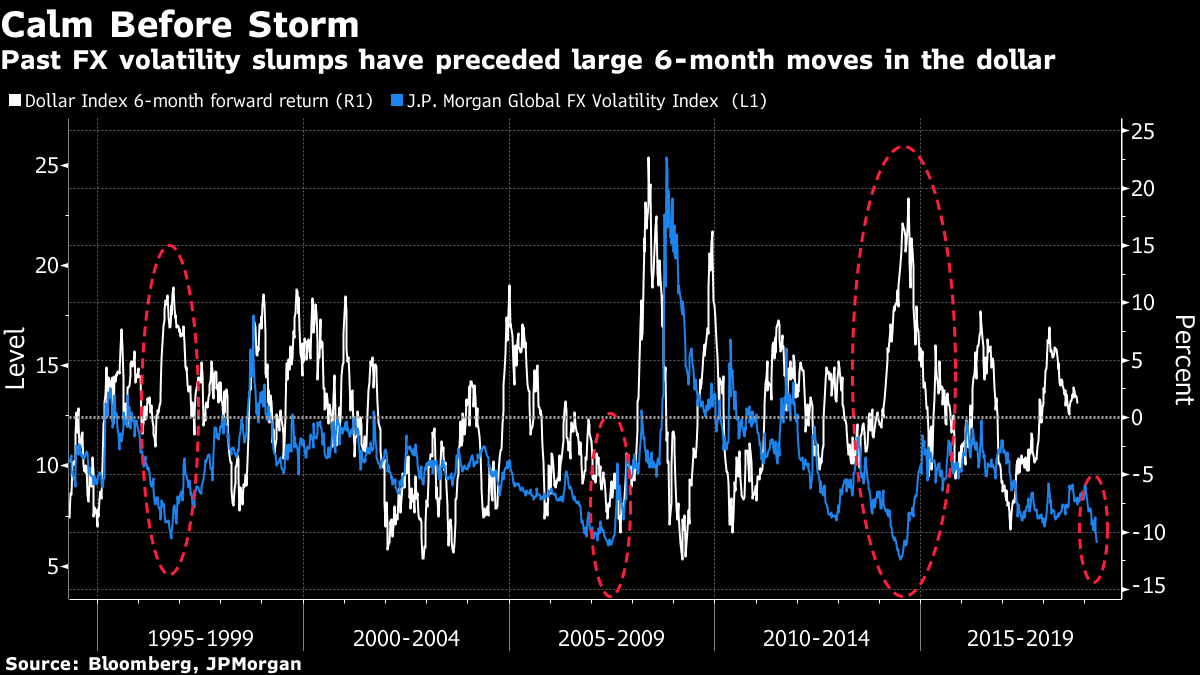
Currency traders should brace for a large move in the dollar, if past periods of low volatility are a guide.
Over the last 25 years, there have been three previous troughs in the JPMorgan Global FX Volatility Index. Each time, the U.S. Dollar Index has moved around 10 per cent over the subsequent 6-months, according to data compiled by Bloomberg. The volatility gauge is currently trading at its lowest in 5 years.
“We’ve seen this type of pattern show up a number of times before, and each time it did it preceded a major move,” in the dollar, wrote Callum Thomas, founder and head of research at Topdown Charts, in a note to clients. This is great “for both U.S. dollar bulls and bears...the only people it won’t suit is those who expect the U.S. dollar to spend the rest of the year stuck in that tight trading range.”
A trough in currency volatility in 1996 preceded a more than 10 per cent rise in the greenback, while a lull in 2014 came before the dollar rose more than 15 per cent over the following six months, according to Bloomberg calculations. The volatility slump in 2007 preceded a more than 10 per cent drop in the U.S. currency.
Expected swings in foreign-exchange markets have plunged amid a dovish pivot from global central banks and a rally in risk assets after losses late last year. Still, strategists from Morgan Stanley to the Canadian Imperial Bank of Commerce are warning about a return to more volatile markets.
The Dollar Index has risen about 0.8 per cent this year, compared to a 4.4 per cent gain in 2018 and a 9.9 per cent drop the previous year. The U.S. currency has strengthened against half of its Group-of-10 peers and weakened against the other half.
“As we start to move into the middle and second half of the year, markets will need to reassess their assumptions,” Jeremy Stretch, head of Group-of-10 currency strategy at CIBC in London, said on Bloomberg radio. “That may well bring forth a degree of volatility back into the market.”
--With assistance from Liz Capo McCormick.