May 14, 2018
Larry Berman: Is the long-term bull market over for bonds?
By Larry Berman

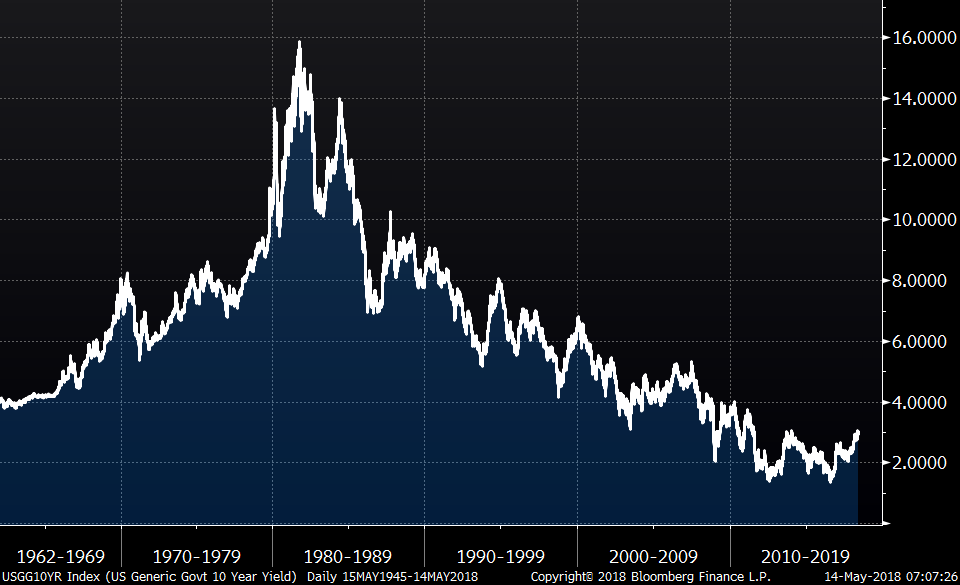
Judging if the near 37-year bull market in interest rates is over is not a simple exercise. Many bond pundits have made the call recently. The pattern of lower yield highs and lower yield lows have continued for decades. Calling the end of this trend is not simply a charting exercise, the world is not that simple.
For example, there is almost double the debt in the world today as there was in the years before the Great Recession of 2008-09 (in part because of falling generational rates).
With central banks now starting to reduce balance sheet assets and deficits on the rise, the supply-demand equation is changing. This is the main reason many have called the end to the secular bull market in interest rates. The whiff of late-cycle inflation pressures are building too, adding fodder to the notion that the multi-decade disinflation trend is over. We have a different view.
One of the primary reasons prices have been contained for decades is a combination of technological innovation and demographics. An aging population in aggregate is very different than a very young population. At 25, you are about to get married, have kids (much fewer than previous generations), buy a home, if you can, and enter the higher earning years. Today, there are more people retiring than are getting married and having kids. When the central bank cuts interest rates, a prudent newly-retired 65-year-old does not go out and buy a bigger home or car.
With life expectancy on the rise, savings need to fund a longer lifespan. When governments borrow and spend money to boost the economy, fixing the potholes costs the same as building that the road did years ago, but does not create the same degree of economic momentum. None of these themes have changed and are not going to change for decades. DO NOT LOOK FOR A PERIOD OF HIGH INFLATION. The world simply cannot handle much higher debt service costs.
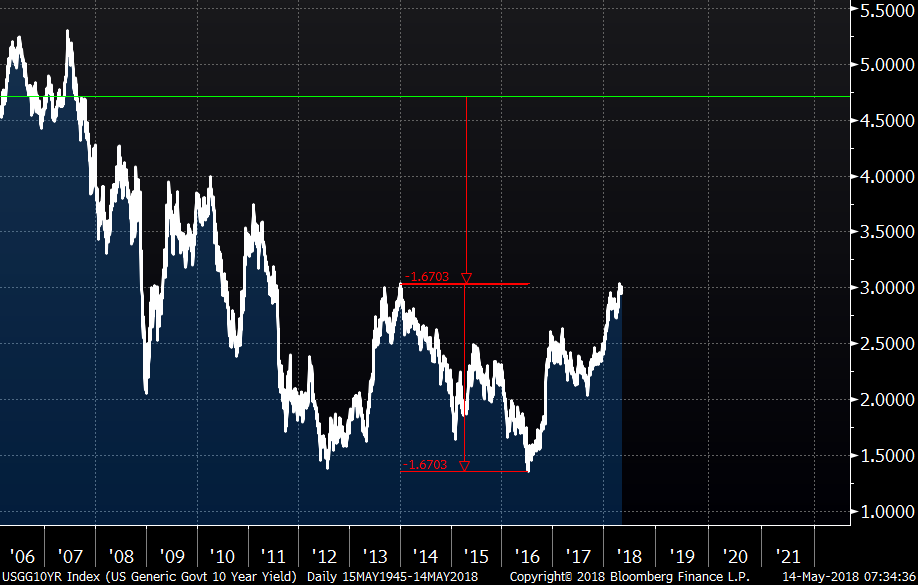
There is an important technical pattern developing called a double bottom. According to Thomas Bulkowski at The Pattern Site, this is one of the patterns that has the most efficacy. A break of yield resistance at 3.05 per cent would target a move to 4.72 per cent based on the measured objective of the pattern. This would take yields back to where they were before the economy and housing market collapsed in 2007. With so much debt outstanding today, this would put a break on the economy like we have not seen in decades.
Our conclusion is yields cannot go that high — it would trigger a massive recession, which would see the Federal Reserve cut rates back to zero and possibly negative again. We see the next recession being even more elongated that the current economic malaise. Remember, the only reason the world has recovered is that debt levels outstanding have almost doubled in the past decade.
That said, this important technical level will likely break in the coming weeks or month, and that may cause the next round of anxiety in the equity markets. I see 3.50 per cent as about the maximum rate the economy could sustain without the breaks being hammered. I also see the two-year rate hitting 3.50 per cent in the first half of 2019, which would give us a flat yield curve and increase recession risks substantially.
U.S. floating rate notes and high dividend covered call ETFs are likely to be the best combination along with some gold and cash in your portfolios to get through the next year or so with the least amount of volatility in your portfolios.
Follow Larry Online:
Twitter: @LarryBermanETF
LinkedIn Group: ETF Capital Management
Facebook: ETF Capital Management
Web: www.etfcm.com


