Jan 13, 2020
Larry Berman: U.S. equities have never been more expensive
By Larry Berman
Larry Berman: U.S. equities have never been more expensive
VIDEO SIGN OUT
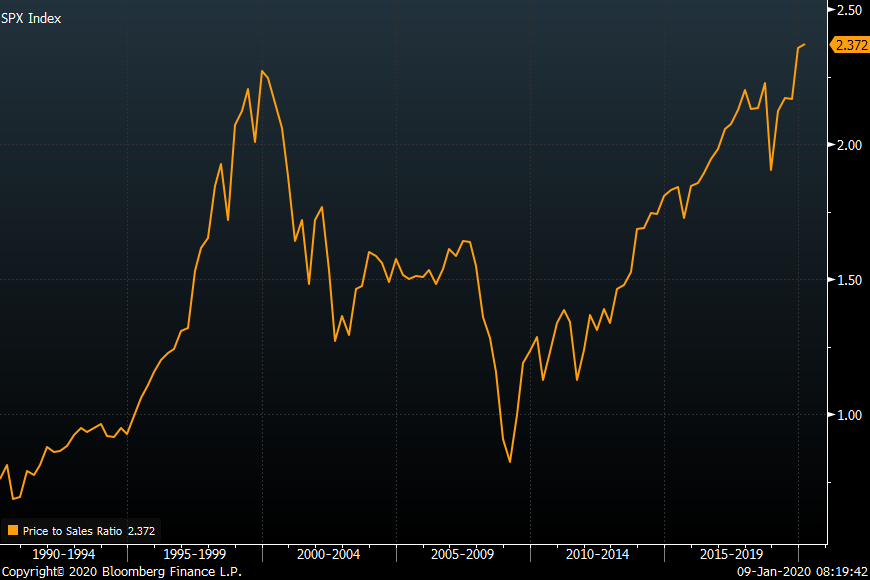
Two measures of valuation for U.S. equities are off the charts: Price-to-sales and enterprise-value-to-EBITDA. And according to consensus estimates, corporate profits likely dropped in Q4, dragging down annual earnings growth to the smallest in three years. A lot of investors are fine with that, it seems, as hope grows eternal.
History suggests the S&P 500 can rise about seven per cent in the year following a spate of poor corporate earnings. Last year’s 30-per-cent-plus gain was in anticipation of a strong recovery in earnings growth rates. We are not so sure this will happen.
An article in Barron’s over the weekend looks at several metrics measuring the valuation of the market based on historical averages. By most measures, the market is very expensive.
SIZING UP THE MARKET
| VALUATION MODEL | CURRENT READING | VERSUS HISTORIAL AVERAGE |
|---|---|---|
| Market Cap to GDP | 203% | Very Expensive |
| S&P 500 Forward P/E | 18.9% | Very Expensive |
| Enterprise Value/Sales | 2.6% | Very Expensive |
| Rule of 20 | 20.2% | Fairly Valued |
| Yield Gap vs 10-Year Treasury | 3.4% | Inexpensive |
| S&P 500 Price/Book Ratio | 3.7% | Expensive |
Source: Charles Schwab, Goldman Sachs
According to Investopedia, price-to-sales (P/S) ratios are a key analysis and valuation tool. The ratio shows how much investors are willing to pay per dollar of sales. Like all ratios, the P/S ratio is most relevant when used to compare companies in the same sector. A low ratio may indicate the stock is undervalued, while a ratio that is significantly above the average may suggest overvaluation. When compared with the bubble peak in 2000, when there were no sales yet, versus today when there are, this statistic is a major warning.
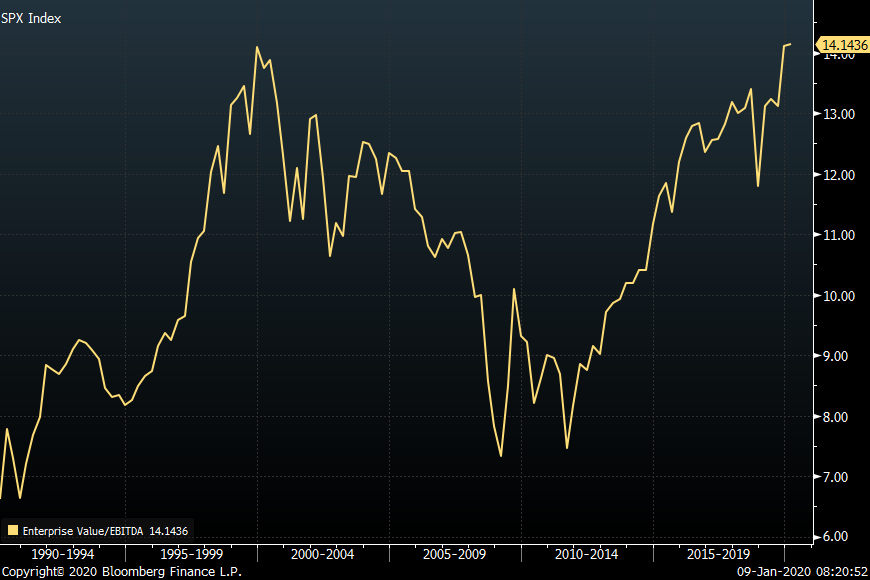
Also according to Investopedia, the ratio of enterprise value (EV) to earnings before interest, tax, depreciation, and amortization (EBITDA) varies by industry. However, the EV/EBITDA for the S&P 500 has typically averaged from 11 to 14 over the last few years. EBITDA measures a firm's overall financial performance, while EV determines the firm's total value.
As of last week, the average EV/EBITDA for the S&P was 14.14. As a general guideline, an EV/EBITDA value below 10 is commonly interpreted as healthy and above average by analysts and investors.
The enterprise-value-to-EBITDA ratio is calculated by:
• EV divided by EBITDA or earnings before interest, taxes, depreciation, and amortization
• EV (the numerator) is the company's enterprise value and is calculated as follows: market capitalization + preferred shares + minority interest + debt - total cash
This popular metric is used as a valuation tool to compare the value of a company, debt included, to the company’s cash earnings less non-cash expenses. It's ideal for analysts and investors looking to compare companies within the same industry.
Typically, EV/EBITDA values below 10 are seen as healthy. However, the comparison of relative values among companies within the same industry is the best way for investors to determine companies with the healthiest EV/EBITDA within a specific sector.
BENEFITS OF EV/EBITDA ANALYSIS
Just like the P/E ratio (price-to-earnings), the lower the EV/EBITDA, the cheaper the valuation for a company. Although the P/E ratio is typically used as the go-to-valuation tool, there are benefits to using the P/E ratio along with the EV/EBITDA. For example, many investors look for companies that have both low valuations and solid dividend growth by analyzing P/E and EV/EBITDA.
Analysts are projecting that S&P 500 profits fell 1.6 per cent in the last three months of 2019. Investors will likely pay closer attention to forecasts to see if companies confirm the rebound currently expected by analysts: A 3.2-per-cent rise in the first quarter of 2020, with a full-year forecast of 9.1-per-cent growth, according to data compiled by Bloomberg Intelligence.
Cyclical sectors of the market are expected to lead the rebound in earnings growth this year, with energy stocks set to see growth of 21 per cent, which will not last. Industrials and materials are each forecasted to rise, according to data compiled by Bloomberg, about 14 per which will also not last. The best of Trump’s stimulus agenda is behind us and no longer offers a tailwind. Despite this week’s signing of a phase one deal between the U.S. and China, tariffs will continue to provide headwinds to growth. The vast majority of earnings growth was due to tax cut plus share buybacks. This is why the price-to-sales ratio has never been worse. Be cautious and don’t buy into the fear of missing out on a rally.
Twitter: @LarryBermanETF
LinkedIn: ETF Capital Management
Facebook: ETF Capital Management
Website: www.etfcm.com


