Aug 7, 2018
Cameron Hurst's Top Picks: Aug. 7, 2018

Cameron Hurst, chief investment officer at Equium Capital Management
Focus: U.S. equities
_______________________________________________________________
MARKET OUTLOOK
In the doldrums of summer, absent the regular news flow of non-holiday months, a quiet pessimism can creep into the market’s collective psychology. Particularly with the political and market volatility we’ve experienced this year, investors needn’t look far for something to worry about: trade wars, NAFTA, Turkey and emerging market breakdowns, isolationist and totalitarian politics. Indeed, we live in interesting times.
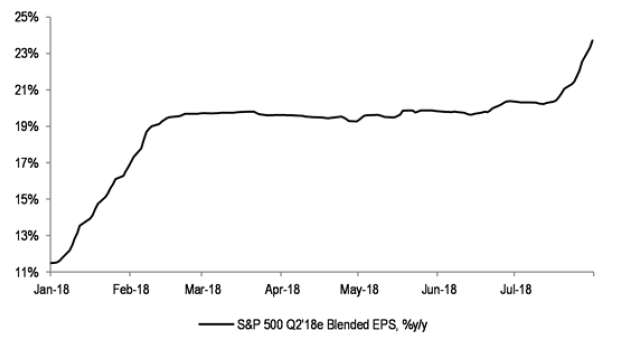
Now more than ever, it’s critical to stick to a proven investment process, one that mutes emotional reactions to market noise and maintains focus on factors that truly drive markets. Earnings, for example, have been nothing short of stellar lately. After nearly two-thirds of U.S. companies have reported, 86 per cent are beating earnings per share (EPS) estimates, 72 per cent are beating revenue estimates and the group is enjoying strong EPS and revenue growth of 25 per cent and 10 per cent, respectively, over last year. Q2/18 EPS estimates were holding flat around 20 per cent or so for most of the year as analysts and investors worried they’d gotten ahead of themselves. But in the last few weeks, with hard data in hand, Q2 estimates jumped up to 25 per cent (Chart 1) on the back of stellar reports and less-negative-than-expected management commentary.
Looking at earnings, among myriad other fundaments indicators, our fundamental research team continues to find places to put money to work and suggests this isn’t the time to run to cash and gold. That being said, our technical work clearly highlights rotation under the surface that bears watching. Indicators like asset managers vs. SPX Index broke down in June; transports vs. SPX Index has been weak most of the year; even small- and mid-cap indexes flagged against the SPX Index in July, although cap-focused indicators can be a little twitchy.
Semiconductors have also been uninspiring on a relative basis since first peaking last November, but like those indicators above, semis haven’t suffered a material absolute price break, just remained largely range-bound. This is critical because preempting the break is tempting and plays to our fake-news-inspired nervousness. Despite being a conservative investment manager, we would be the first to point out that missing the last push higher in equities before the real top is put in can be costly in performance terms.
So where does that leave us? Interestingly, the last three or so months have seen improved performance from late-stage sectors and those more overtly defensive. Healthcare is a good example, as it’s more typically a late-stage outperformer. Previously, we’ve been neutral on the sector, favouring just the equipment and managed care industry groups. Now however, most of the healthcare industries groups are relatively outperforming and, not surprisingly, the sector as a whole features more prominently in our portfolios at present.
Real estate is similarly prominent now and over the last number of months we evolved the portfolios to include a healthy exposure to the sector. Other changes included moving from direct, explicit exposures in tech towards a balance of tech, discretionary and healthcare, using broad basket Nasdaq 100 exposure, and now to some focused discretionary and considerably more healthcare.
This evolution reflects our strategy of maintaining exposure to leadership areas of the market, so long as the risk/reward justifies the position, while concurrently observing our goal of preserving capital by tactically reducing and exiting positions that breakdown either technically or fundamentally.
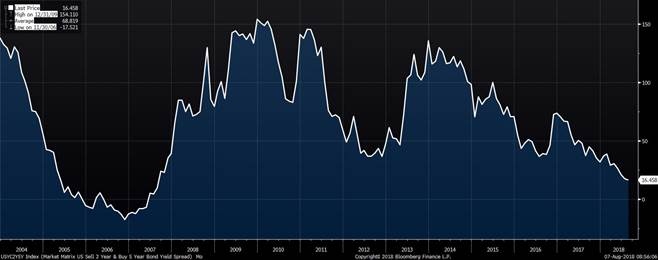
Lastly, credit spreads remain well-behaved, but haven’t nearly returned to the tights of January. As global multi-asset investors, we place a high degree of importance on credit signals and continue to monitor trends for signals of further deterioration. Believing the market is in later stages of this fantastically long rally and with the yield curve a sneeze away from flat (Chart 2) while emerging markets exhibit significant credit and currency stress, we remain vigilant and will move quickly to protect capital should signs of stress move closer to home.
TOP PICKS
REAL ESTATE SELECT SECTOR SPDR ETF (XLRE.N)
We believe it’s time to balance portfolios with incremental defensive exposure. Real estate’s modestly pro-cyclical tilt versus other bond proxy sectors makes it a favourable first step.
We prefer broad-basket sector ETF exposure through XLRE over the industry-standard IYR owing to lower cost and preferential industry weightings towards secular growth themes, namely data centres, storage and towers.
- “Growing slower” is good for REITs.
- Trade war rhetoric is more significantly impacting equity volatility and economic indicators around the globe.
- It now appears economic momentum could be slower in H2/18 and 2019 than expected, although still positive, which caps longer-term interest rates and staves off cap rate compression from what we previously expected.
- Secular growth in industrial (think fulfilment centres for Amazon), healthcare and tech-centric REITs maintains growth in the group despite slower than expected macroeconomic tailwinds
- If we’re too optimistic and growth slows more precipitously, rate compression will support low-cap rates in the sector for the early stages of the slowdown, allowing time for more defensive tactical repositioning.
HEALTHCARE SELECT SECTOR SPDR ETF (XLV.N)
A typical late-stage outperformer, we’re more positive on the healthcare sector now that breadth is improving, the notable pharma/biotech is less of a headwind and end-market fundamentals are strong.
- Equipment/devices is still the best performing industry group in healthcare year-to-date (IHI up 21 per cent versus 9 per cent for the broad sector). We would focus exposure there, but are now open to taking a broader exposure as well.
- The group is exposed to positive secular trends: aging population, lifestyle diseases, the obesity epidemic, emerging market demand. It’s also less of a political hot potato now.
- It offers investors stability and a defensive tilt. Channel checks demonstrate stable end-markets in devices with respect to volumes and pricing.
- Worldwide hospital capital spending trends strong, as political uncertainty around the U.S.’s Affordable Care Act has decreased and private capital spending in China picks up.
- Tax reform provides access to cash outside the U.S. (77 per cent of large cap cash is outside America) and flexibility to undertake M&A, with management showing a preference for tuck-ins.
- There’s some “Amazon risk” in broad-based healthcare exposure, but it’s focused in the distributors which shouldn’t hit sector too badly if realized.
ALERIAN MLP ETF (AMLP.N)
We’ve been positive on energy, but shifted our exposure to the more defensive pipeline names from exploration and production as oil approaches what we view as closer to underlying marginal cost in the $65 to $75 range.
- Technically, the relative performance of the group broke out in June after a multi-year period of underperformance as excess capacity had been built up during the bull run in oil, with the help of significant leverage.
- We now view that unwind as largely complete and, with continued strong global demand for oil and increased U.S. exports, U.S. pipeline capacity is now constrained (Permian likely through 2020), driving up volumes and giving pricing power back to the pipeline operators.
- With a well supported 7.4 per cent dividend yield (more than offsetting the high cost of ownership), investors are being paid a significant yield for exposure to a group with improving fundamentals and growth opportunities.
- The recent Energy Transfer Partners-Energy Transfer Equity announcement is yet more evidence that the sector is making headway at simplifying its structure and improving its balance sheet, which in turn should lead to better growth opportunities and less risk for investors.
| DISCLOSURE | PERSONAL | FAMILY | PORTFOLIO/FUND |
|---|---|---|---|
| XLRE | N | N | Y |
| XLV | N | N | Y |
| AMLP | N | N | N |
PAST PICKS AUG. 9, 2017
E*TRADE FINANCIAL (ETFC.O)
- Then: $41.15
- Now: $61.56
- Return: 50%
- Total return: 50%
ISHARES MSCI INDIA ETF (INDA.N)
- Then: $33.90
- Now: $35.69
- Return: 5%
- Total return: 6%
RAYTHEON (RTN.N)
- Then: $179.30
- Now: $197.62
- Return: 10%
- Total return: 12%
Total return average: 23%
| DISCLOSURE | PERSONAL | FAMILY | PORTFOLIO/FUND |
|---|---|---|---|
| ETFC | N | N | N |
| INDA | N | N | N |
| RTN | N | N | N |
TWITTER: @equiumcapital
WEBSITE: equiumcapital.com
LINKEDIN: Equium Capital


