May 10, 2021
Larry Berman: Gold is at an important inflection point. Should you buy or sell?
By Larry Berman

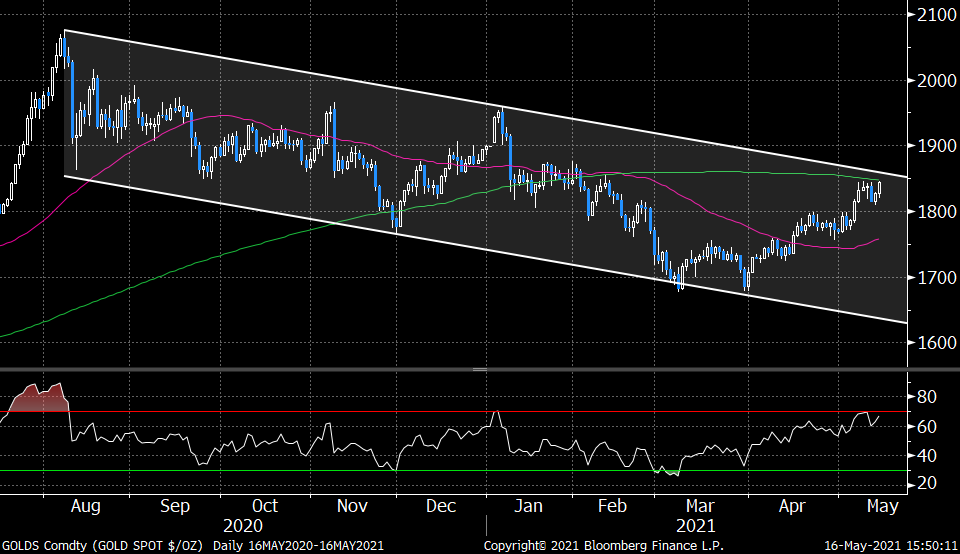
When it comes to ex-anti forecasting, time frame is everything. As much as the industry preaches that timing does not work, decision-making about risk and return has everything to do with timing. The first chart we look at of gold bullion spot price in U.S. dollars over the past nine months is unmistakably bearish-looking. The trend channel connecting a series of lower highs and lower lows is now being tested. The intermediate trend 50-day average broke below the now flatlining 200-day average a few months ago, which is now being tested. The price of gold has failed four times in the past week to break and hold above these declining trendlines. A weekly close above these falling resistance levels would we unmistakably bullish. However, the early January breakout had similar characteristics, but the weekly chart looked more ominous.
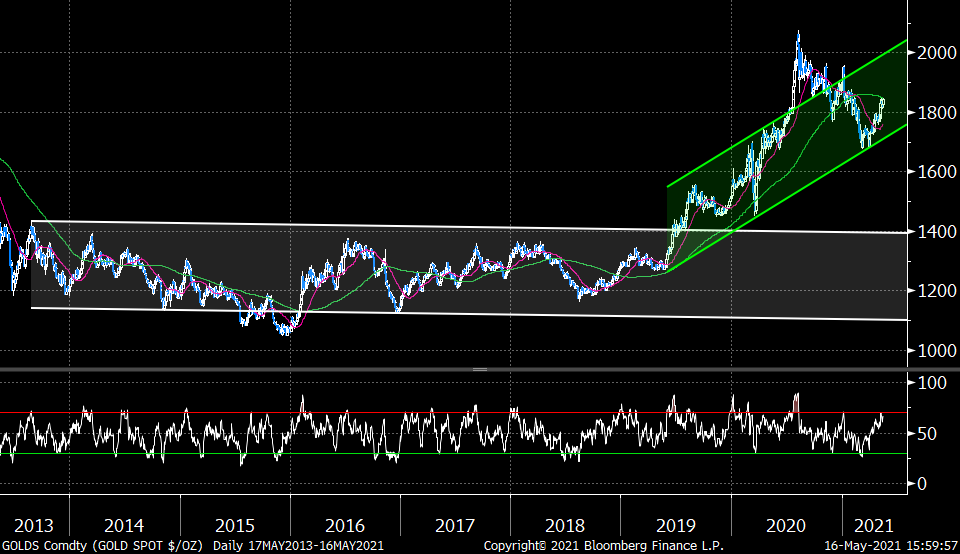
For me, I always look at multiple timeframes. The risk/return question is always a timeframe consideration. Moving back one degree (from one year to a business cycle) and you get a very different view. We see a breakout from a multi-year base pattern that could easily last several more years. It paints the current bearish chart as much more constructive. But that too can be debated as we will see.
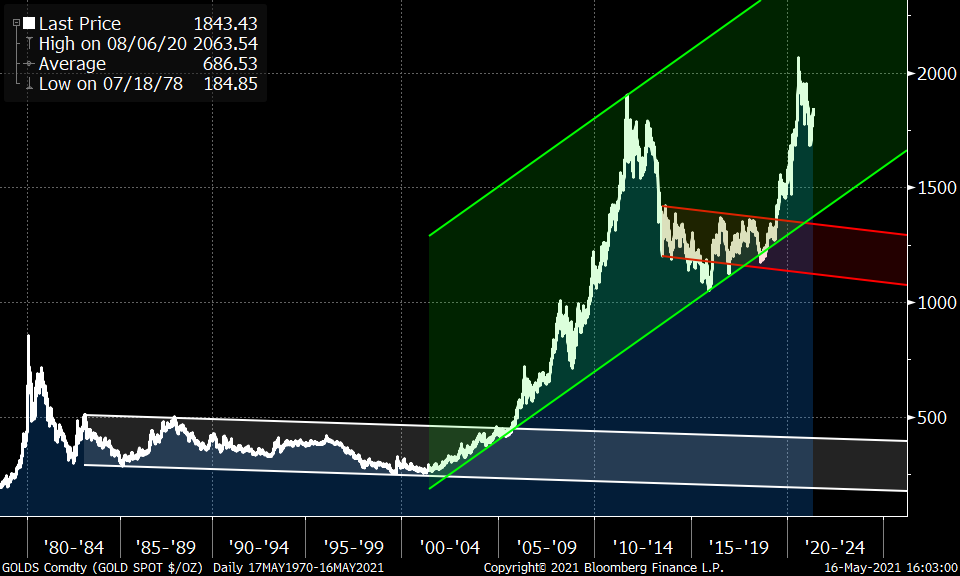
And rolling out another degree (big picture), we see an even more positive picture. Gold’s breakout from a multi-year base in the early 2000s (when the Greenspan Fed first went to a near-ZIRP policy) led to a decade-long trend. The cost of money is a huge factor driving gold’s valuation. Thus, from our multi-timeframe view, the current consolidation is likely just a pause in what likely has a year left to trend on the upside according to the trend channels.
Now here is where is gets confusing. The same two people looking at this same chart could paint a much different picture given other biases. This view would argue that we failed to hold the breakout and now likely face a multi-year (decade) consolidation like we have seen before. So which is it, Larry?
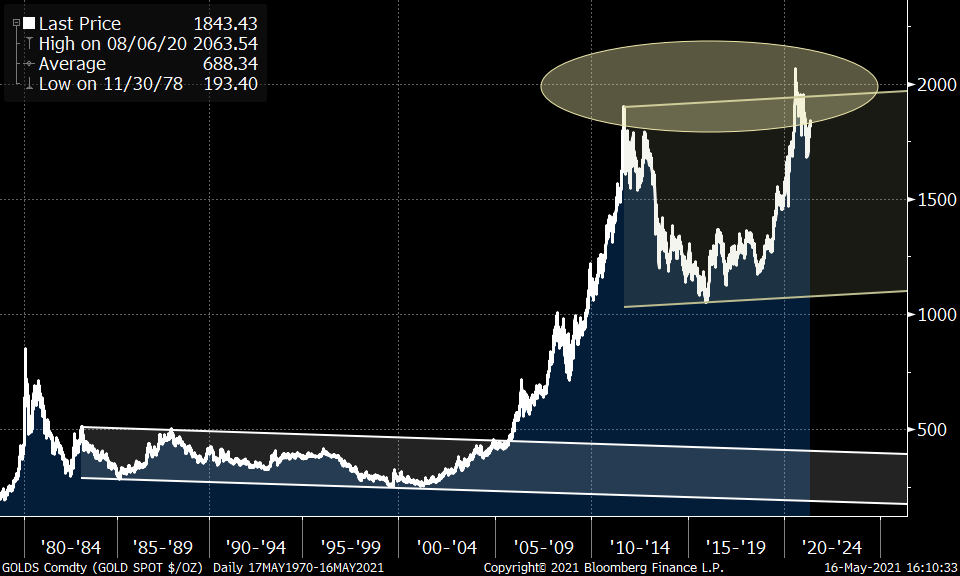
So which one will be the correct one ex-post? Here is where an understanding of fundamentals help us define what we see in the charts. The “why” really matters. The timeframe is critical. A look at the 80s-90s consolidation saw falling inflation and much higher real interest rates compared to today. The ultra-stimulative Fed policies started when the tech bubble burst in the early 2000s and gold has been a very good asset class ever since. In the 80s and more so in the 90s, central banks were dumping gold as a reserve holding having abandoned the link to gold in the early 70s. But the fact that the amount of debt in the world is not affordable at a higher cost likely necessitates a monetization. Real yields will likely stay ultra low and provide little competition to gold. In the 80s-90s holding government debt as a reserve was very profitable. Today, when central banks want more inflation, not so much.
I remain bullish on gold as a store of value as we move into a regime where governments will literally be digitizing the money supply and forced to monetize deficits. This will likely be a major factor for decades. Gold will not likely be replaced by crypto, but who knows how long the mania can go. It’s a huge factor working against gold’s potential. And unlike tulips, zeros and ones don’t die each year. Just don’t lose you password.
Subscribe to my new YouTube channel LarryBermanOfficial which is the new site for all our educational content and my new weekly market recap and ETF bull and bear picks of the week.
Follow Larry online:
Twitter: @LarryBermanETF
YouTube: Larry Berman Official
LinkedIn Group: ETF Capital Management
Facebook: ETF Capital Management
Web: www.etfcm.com

, operated by Japan Exchange Group Inc. (JPX), in Tokyo, Japan, on Thursday, Oct. 29, 2020. Japanese stocks pared losses after the Bank of Japans policy decision and as U.S. futures bounced back following a global equity rout. Photographer: Bloomberg/Bloomberg, Photographer: Bloomberg/Bloomberg")

 annual meeting in Davos, Switzerland, on Tuesday, Jan. 17, 2017. World leaders, influential executives, bankers and policy makers attend the 47th annual meeting of the World Economic Forum (WEF) in Davos from Jan. 17-20., Bloomberg")


