Jul 8, 2019
Larry Berman: S&P 500 at 3,000. A hurdle, ceiling or emotional test?
By Larry Berman
Larry Berman: S&P 500 at 3,000. A hurdle, ceiling or emotional test?
VIDEO SIGN OUT
We previously wrote about the rapid decline in earnings outlooks for the S&P 500. We focus on this benchmark because it represents about 40 per cent of the world equity market capitalization and houses most of the largest companies in the world. The U.S. market is more than 52 per cent of world capitalization while Canada is a rounding error over three per cent. The only top 10, non-U.S. company in the world index is Nestle SA, while all others are U.S. based.
Last week, in the wake of the G20 Summit in Japan, calmer heads (appear to have) prevailed in the U.S.-led global trade battle and the S&P 500 reached new all-time highs. At the same time, expectations for earnings are sliding, which means that investors need to be willing to pay far more for a weaker rate of economic and earnings growth. But how long can it last?
Enter the psychology of big round numbers. Who remembers the Dow 10,000? How about Dow 1,000? The psychology of big round numbers has its lore on Wall Street that goes back at least half a century. It mostly started in the 1960s and 1970s when the 30 stocks of the Dow index, which today accounts for less than one-third of the S&P 500, struggled to hold above 1,000 for more than a decade. At the same time, the S&P 500 was struggling to hold above 100, though really traded above that level by more than 20 per cent a few times. Back then, the Dow Jones Industrial Average was the index! Today, the S&P 500 is the index for Wall Street, while the Dow may still be the index for Main Street and 1600 Pennsylvania Avenue.
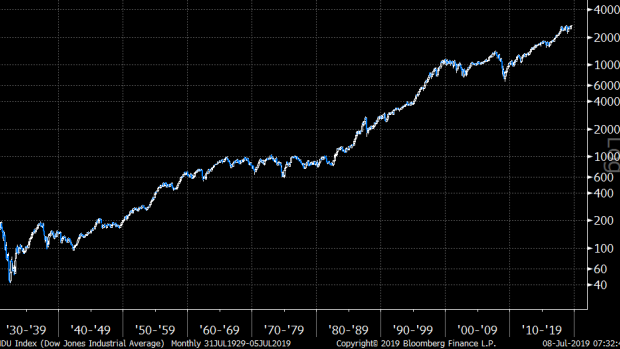
The S&P 500 was officially introduced on March 4, 1957, by Standard & Poor’s. McGraw-Hill acquired it in 1966. The S&P Dow Jones Indices owns it now. That is a joint venture between McGraw Hill Financial, CME Group, and News Corp., the owner of Dow Jones. The S&P Dow Jones Indices publishes more than one million indices.
Milestones
| DATE | CLOSE | EVENT |
|---|---|---|
| Jan. 3, 1950 | 16.66 | Record closing low |
| June 4, 1968 | 100.38 | First time above 100 |
| Oct. 19, 1987 | 224.84 | Black Monday, the largest per cent loss (20.5 per cent) |
| March 24, 1995 | 500.97 | First close above 500 |
| Feb. 2, 1998 | 1,001.27 | First close above 1,000 |
| Oct. 9, 2007 | 1,565.15 | Highest close before financial crisis |
| Oct. 13, 2008 | 1,003.35 | Largest per cent gain of 11.6 per cent |
| March 28, 2013 | 1,569.19 | New record high |
| Aug. 26, 2014 | 2,000.02 | First close above 2,000 |
| Sept. 21, 2018 | 2,929.67 | Record closing high |
| Oct. 3, 2018 | 2,937.06 | Highest intra-day |
The S&P 500 broke the 2018 highs in May this year and it appeared at the time to set up a major double top as May saw the index fall about six per cent. Many technical observers and analysts like us were talking and writing about this pattern. Last week, that pattern was blown out of the water when the index made new highs on trade optimism.
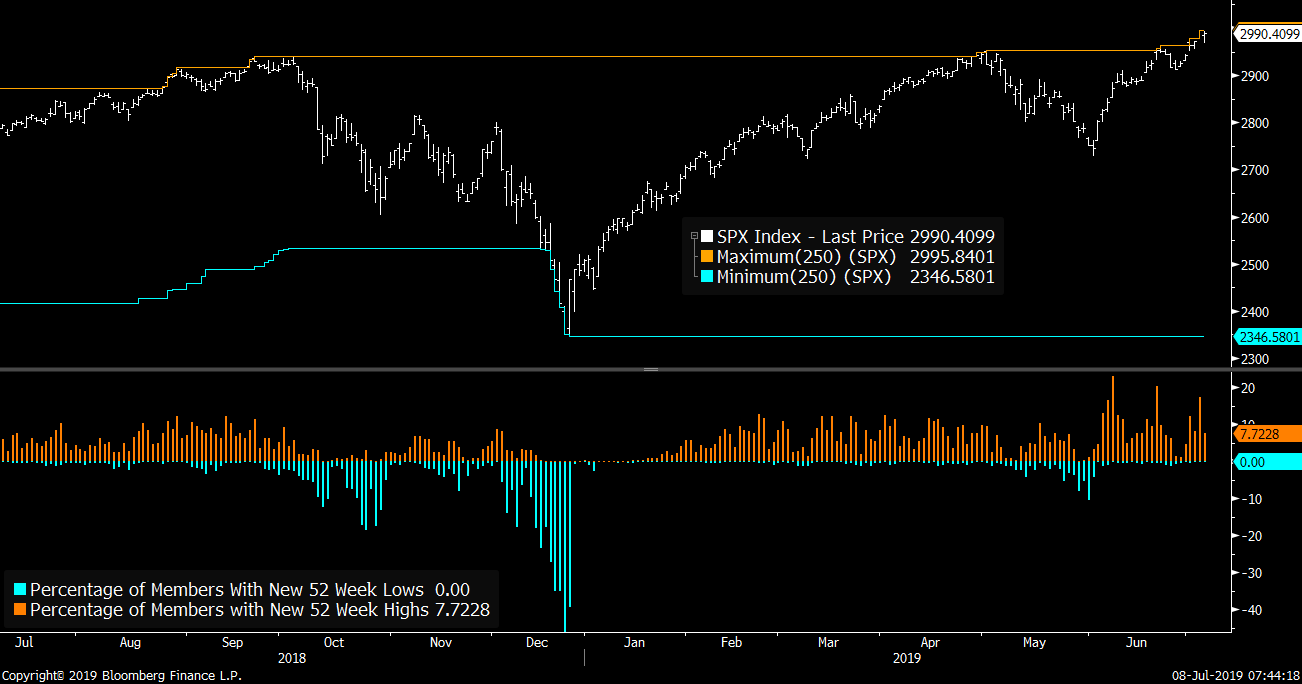
A closer look under the hood shows that the percentage of stocks in the index reaching new highs was slightly weaker than we saw in May. This divergence tells us that fewer stocks are lifting the boat and is not likely the basis of a meaningful breakout from here, especially when you overlay the qualitative assessment of weakening earnings.
Do not succumb to the Fear of Missing Out (FOMO) emotion, which will no doubt grip some investors that have shifted to cash-like holdings. As always, your portfolios should not be set up to time the markets – they should be set up to help you reach your long-term financial goals. Most of our portfolios now are set up with higher yielding exposures and lower overall market risk. FOMO and Sleep-at-Night are arch enemies in the emotional roller coaster ride that markets always challenge investors with. The bottom line is, the S&P 500 at 3,000 means little more than making some media headlines. Don’t let it impact your long-term goals.


