Jul 15, 2019
Larry Berman: Has the tech rally peaked?
By Larry Berman
Larry Berman: Has the tech rally peaked?
VIDEO SIGN OUT
As a classically-trained technical analyst, one of the areas of study we learn when completing the Chartered Market Technician designation is an understanding of the market topping process. By comparison, it’s much easier to identify market bottoms due to the emotion capitulations when faced with financial losses. Compared to market tops, measuring complacency is very different and siginifcantly more difficult.
One of the very best papers ever written on the subject is the seminal works by Paul Desmond. One of my favourite interviewers in financial circles is Barry Ritholz. This link from an interview with Desmond in 2014 highlights some of the key things he looks for.
Desmond highlights four important characteristics of market tops in his seminal paper that you can get here. Last week we looked at stocks making new 52-week highs and we saw a broad weakening trend. Today we are going to look at the leading sector (technology and what is happening between the large cap stocks and the smaller cap stocks. It’s message in quite revealing.
These four include:
1. New 52-week highs
2. Market breadth (advanced/decline line)
3. Capitalization: Small cap, mid cap, large cap
4. Percentage of stocks at 20 per cent or greater from their recent highs
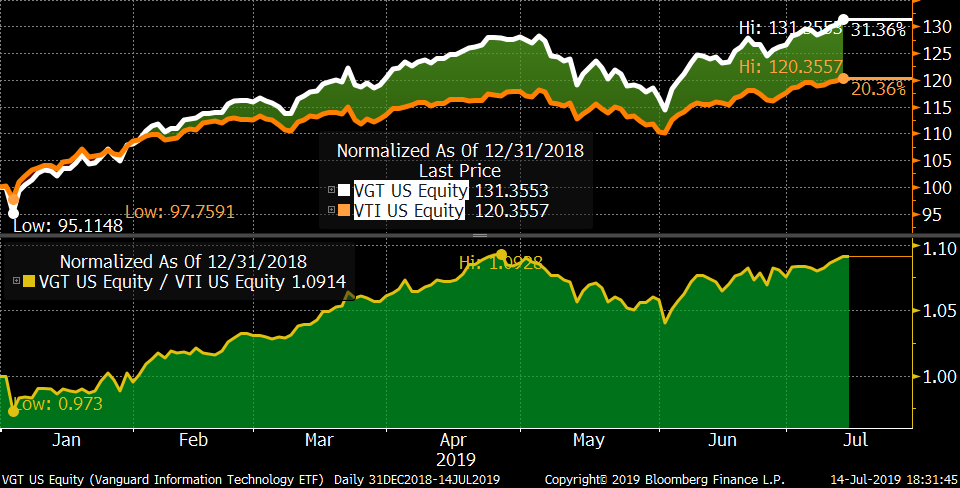
The leading sector by a wide margin has been technology. The Vanguard Technology sector ETF (VGT) holds about 336 securities representing large, mid, and small cap stocks in the U.S. market. We compare it to the Vanguard Total Market ETF (VTI) that holds 3582 securities or basically all equities that trades on US exchanges. YTD, the technology sector ETF representing about 21.35 per cent of the entire market (and less than 10 per cent of the stocks) has outperformed the market by about 10.7 per cent (32.1 per cent to 21.4 per cent) in total return.
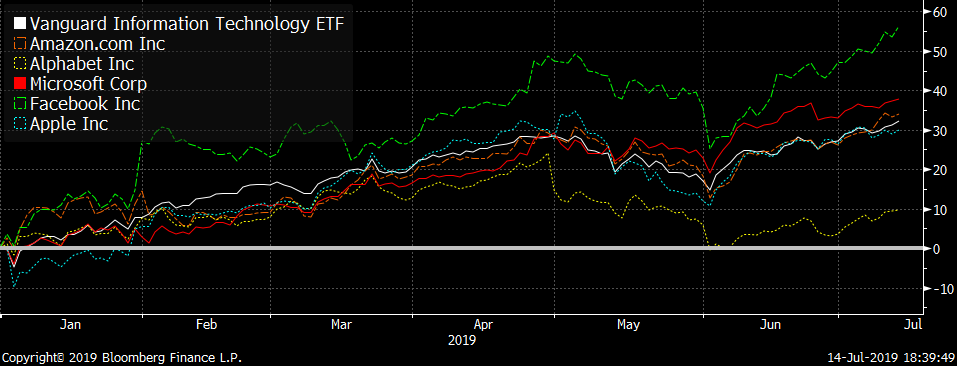
Digging down into the large cap tech stocks in VGT, the FAANGM leaders, that make up close to 40 per cent (AMZN is in the consumer sector) of the tech sector index weight and about 15 per cent of the overall market, we can see GOOGL is already starting to weaken significantly and AAPL not yet making a new high as the market and sector did last week.
But here is the big message in the sector, which is very telling. The 94 per cent plus weight that makes up the large cap sector has about 45 per cent of the stocks compared to the six per cent that has about 55 per cent of stocks. And the smaller cap stocks over the past year are actually down 2.5 per cent while the overall sector is up almost 16 per cent. This is exactly what Desmond was referring to in his seminal paper on market tops.
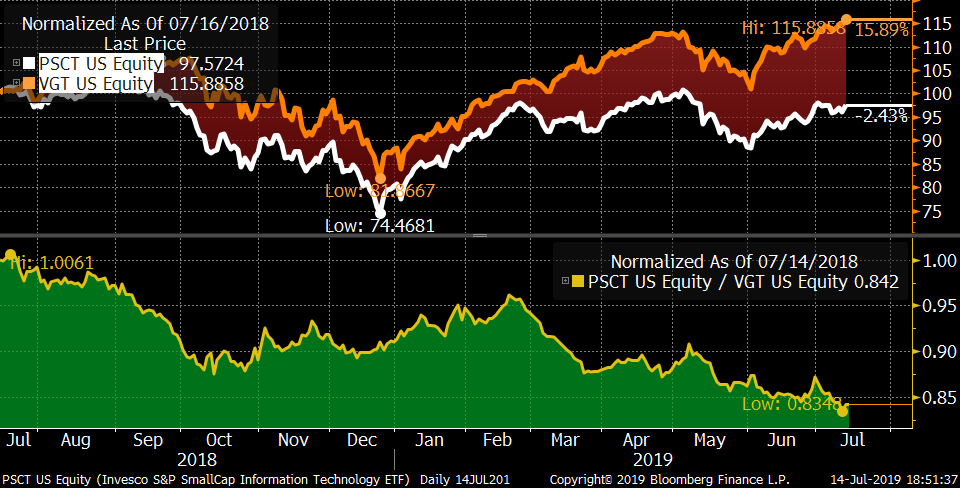
So as we go through earnings season, keep these two ETFs (PSCT, VGT) on your radar and follow their performance. If we see the large cap stocks starting to fail too, it would be another sign that the top is forming.
And finally, a bit of a mia culpa. I’ve been looking for a top for a few years now and despite an increase in volatility since early 2018, the equity market has continued to make new highs under the resilience of central bank liquidity and knock-on leverage has helped markets keeps surprising on the upside, so take what I say with a grain of hindsight bias. Markets can stay irrational for longer than one can remain solvent.
Follow Larry Online:
Twitter: @LarryBermanETF
LinkedIn Group: ETF Capital Management
Facebook: ETF Capital Management
Web: www.etfcm.com
 in Chicago, Illinois, U.S., on Thursday, Nov. 16, 2017. CBOE's proprietary VIX futures and S&P 500 options businesses continue to be its key growth engines, with a lack of substitutes affording it significant pricing power. , Bloomberg")


