Jul 16, 2018
Larry Berman: Market breadth suggests trend is weakening
By Larry Berman

Market breadth analysis is a key factor in determining the probability of a trend continuing. Much of what I try to do when evaluating market risk is to assess a probability of the market going up versus going down over my time horizon, which tends to be one to three months. I look at longer-term horizons, but the confidence factor is very different.
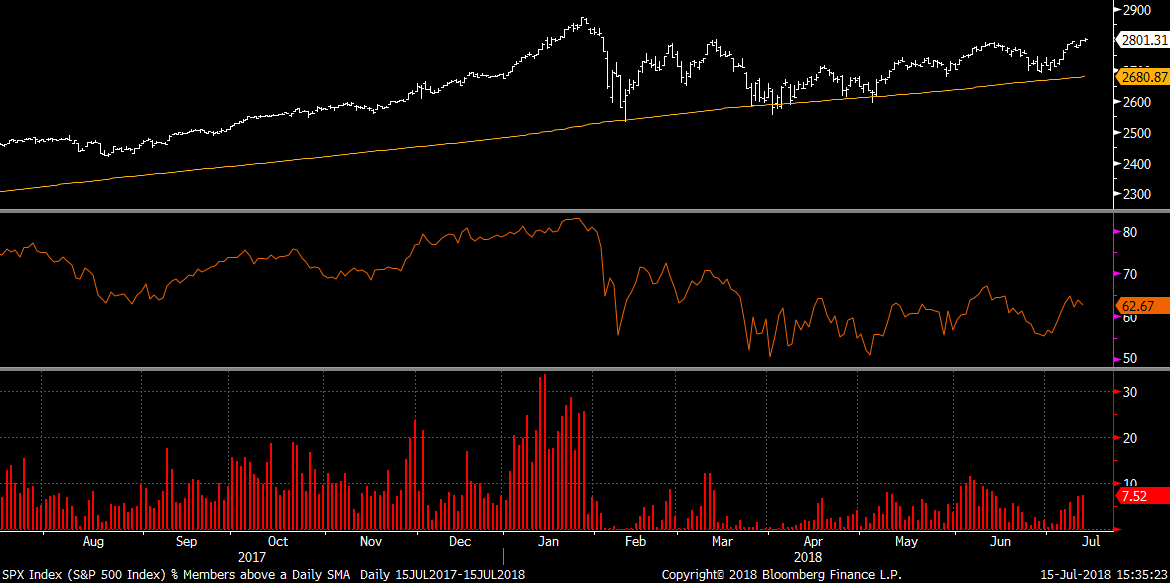
While there are many ways to look at how many stocks are participating in a rally, two that I like are the percentage of stocks above a long-term average (200-day) and the percentage of stocks making new 52-week highs or lows.
For most of 2017 - a very strong market - each new peak saw a large number of stocks participating in the rally. It peaked in January 2018, with well over 80 per cent of stocks trending above their own 200-day averages. The percentage of stocks making new 52-week highs was also very strong and increased for most of 2017. The peak in December and January saw more than 25 per cent of the index hitting new highs.

So far in 2018, each subsequent rally has seen relatively low readings compared to 2017.
This does not mean a top has been reached, nor does it mean investors should sell out their portfolios. However, it does mean the strength of the trend is weakening.
Last week the S&P 500 closed above 2800, which was only a few percentage points from its all-time high. But, there are fewer stocks leading the market higher and that is troubling.
For those using stops and trading the high-momentum stocks, I would suggest tightening up your stops. With cash now paying over 2 per cent, it has a higher yield than the S&P 500.
Follow Larry Online:
Twitter: @LarryBermanETF
LinkedIn Group: ETF Capital Management
Facebook: ETF Capital Management
Web: www.etfcm.com


