Sep 26, 2022
Wall Street Strategists Hunt for Good Omens on US Stock Slide
, Bloomberg News

(Bloomberg) -- After succumbing to full-blown fear this month, American stock traders were braving all manner of global market gyrations to kick off the volatility-hit trading week, from the pound crash at all-time lows to China’s weakening yuan.
The S&P 500 rallied before paring gains, while the Nasdaq 100 jumped as much as 1.4% even as Treasury yields rose to near the highest since 2010.
While one shouldn’t read too much into one-day moves, the equity whiplash Monday rekindled the Wall Street debate on whether bearish sentiment is getting exhausted after the violence of last week’s rout to near-June lows -- or if more bad news will send the market even lower.
Looking under the hood of the stock market for signs on sentiment and positioning, chart pros are pointing to reasons for cheer, even if they still see plenty cause for concern.
Christopher Jacobson, Susquehanna International Group
Investors hoping that negative sentiment has already peaked might be disappointed that stocks didn’t close last week below the year-to-date low and that there wasn’t a bigger spike in the Cboe Volatility Index to signal panic, according to Jacobson at Susquehanna.
But, he adds, those looking for signs of oversold conditions could take solace in the number of stocks now trading below their 50-day moving averages, as well as relative-strength readings that many would characterize as “oversold” levels in the S&P 500 and Nasdaq 100.
Jason Goepfert, Sundial Capital Research
Retail traders spent $18 billion buying put option protection last week, a record, according to Goepfert, chief research officer at Sundial. They’re holding $46 billion worth of index futures net short, also a record. “Leveraged traders are betting on very, very bad things happening very, very soon,” Goepfert said. “Full-on crash mode.”
To contrarians, all that may well suggest that the negative news is already priced into the market and investors are well hedged should things go further south.
Sam Stovall, CFRA Research
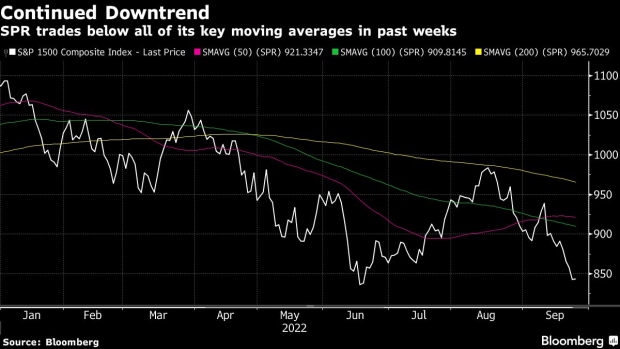
Sam Stovall points to another indicator, where S&P 1500 groups are trading relative to their short- and long-term average prices. When virtually all of them fell below the 50- and 200-day moving averages in the June downturn, that marked a bottom.
The same weakness was on display Friday.
“The S&P 500 and its constituent sectors and sub-industries are ripe for a relief rally,” he wrote. “The only question is whether the rally will have legs or get sold into.”
Jonathan Krinsky, BTIG
Then there’s the upside/downside ratio, a market breadth indicator that shows the link between the volumes of advancing and declining stocks on an exchange.
On a 20-day basis, it is above 60%, which is usually the start of the capitulation threshold, wrote Krinsky, chief market technician at BTIG, referring to activity on the New York Stock Exchange.
“Despite bearish sentiment and positioning much of this year, it’s the transactional indicators that have been lacking for true capitulation,” Krinsky wrote in a note. “Several of those are at or near levels that suggest a bounce should be forming soon, especially as the seasonals become a tailwind in mid-October.”
Nicholas Colas, DataTrek Research
To be sure, the Cboe Volatility Index, a key measure of implied price swings in US stocks, has been relatively subdued throughout the September equity drawdown, all things considered.
While the VIX on Friday saw an intraday high of 32.3, it closed just shy of 30. For Colas, co-founder of DataTrek Research, the true panic level for the index is between 33-36, a range which the VIX has just hit once this year despite market turbulence.
“As much as the news (higher rates, lower non-US currencies, etc.) is not good, it has not yet been surprisingly bad enough to push the VIX past 30 and keep it there for several straight days,” Colas wrote. “That is the signal we want to see before thinking there is a tradable low in place.”
©2022 Bloomberg L.P.


