Jun 19, 2023
Expectations of future volatility contradicts improving breadth message: Larry Berman
By Larry Berman

Using technical indicators to identify market bottoms are relatively easier compared to market tops.
At bottoms, the fear manifests more acutely and the extremes can be intense. One indicator we like to help at market tops are changes in expectations for future volatility. In technical analysis, we are trained to look for divergences. These are patterns that develop over time that suggests that underlying trends and behaviours are changing relative to recent behaviours.
One has been that very few stocks are leading the averages higher this year, though recently more stocks are starting to do better. This is typically a bullish divergence development and is a positive. However, when we look at the price of future volatility, we get more of a cautionary signal.
Volatility is measured several ways. There is a series of futures contracts on the S&P 500 volatility index (VIX) that help us understand the difference between volatility today and what investors are expecting in the future. Historically, the difference between the first VIX futures and the fourth VIX futures contract tells us about expectations between the next 30 days and the next 120 days. This time of year, when seasonal trends are positive and the 120-day window covered the seasonally weak September-October window is particularly interesting.
All will know that September and February are historically the worst performing months. There are many reasons for the seasonal patterns related to cash flows and earnings updates, but that is not our focus here. Divergences that develop in June-July and November-December are particularly interesting to study.
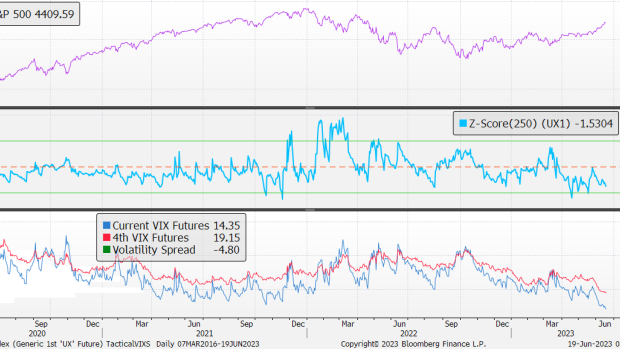
While the overall level of future volatility (fourth month) has come down, it is still elevated and now covers the seasonally weak September-October period, which is always something to consider.
The difference in behaviour between the depressed volatility now and what the market expects four months from now suggests some caution. Now the market just needs a catalyst.
The rampant speculation and leverage seen in the zero days to maturity call options for the S&P 500 has been a major factor over the past few months and is a clear catalyst. How long will/can the speculation continue?
Follow Larry online:
Twitter: @LarryBermanETF
YouTube: Larry Berman Official
LinkedIn Group: ETF Capital Management
Facebook: ETF Capital Management
Web: www.etfcm.com